We use cookies, including third-party cookies from Google to serve personalized ads through AdSense, to operate this site and understand how it is used. By continuing to browse, you accept this use. See our Privacy Policy and Terms of Use for details, including how to opt out of personalized advertising.
Accept
SmartData CollectiveSmartData Collective
  • Analytics
    AnalyticsShow More
    What Kind of Problem-Solving Distinguishes Data Analysts From Software Engineers -- AI-generated illustration
    What Kind of Problem-Solving Distinguishes Data Analysts From Software Engineers
    7 Min Read
    chatgpt image jul 21, 2026, 04 34 30 pm
    4 Core Benefits of Predictive Maintenance after Vibration Analysis
    10 Min Read
    How Does Data Mining Boost Customer Satisfaction in Logistics? Harnessing Analytics for Results -- AI-generated illustration
    How Does Data Mining Boost Customer Satisfaction in Logistics? Harnessing Analytics for Results
    11 Min Read
    chatgpt image jul 13, 2026, 04 23 45 pm
    How Data Analytics Helps Companies Improve User Engagement
    19 Min Read
    chatgpt image jul 13, 2026, 03 59 46 pm
    How Data Analytics Improves Multi-Location Search Strategies
    10 Min Read
  • Big Data
  • BI
  • Exclusive
  • IT
  • Marketing
  • Software
Search
© 2008-25 SmartData Collective. All Rights Reserved.
Reading: Ensemble Prediction
Share
Notification
Font ResizerAa
SmartData CollectiveSmartData Collective
Font ResizerAa
Search
  • About
  • Help
  • Privacy
Follow US
© 2008-23 SmartData Collective. All Rights Reserved.
SmartData Collective > Business Intelligence > Ensemble Prediction
Business Intelligence

Ensemble Prediction

Editor SDC
Editor SDC
2 Min Read
Ensemble Prediction
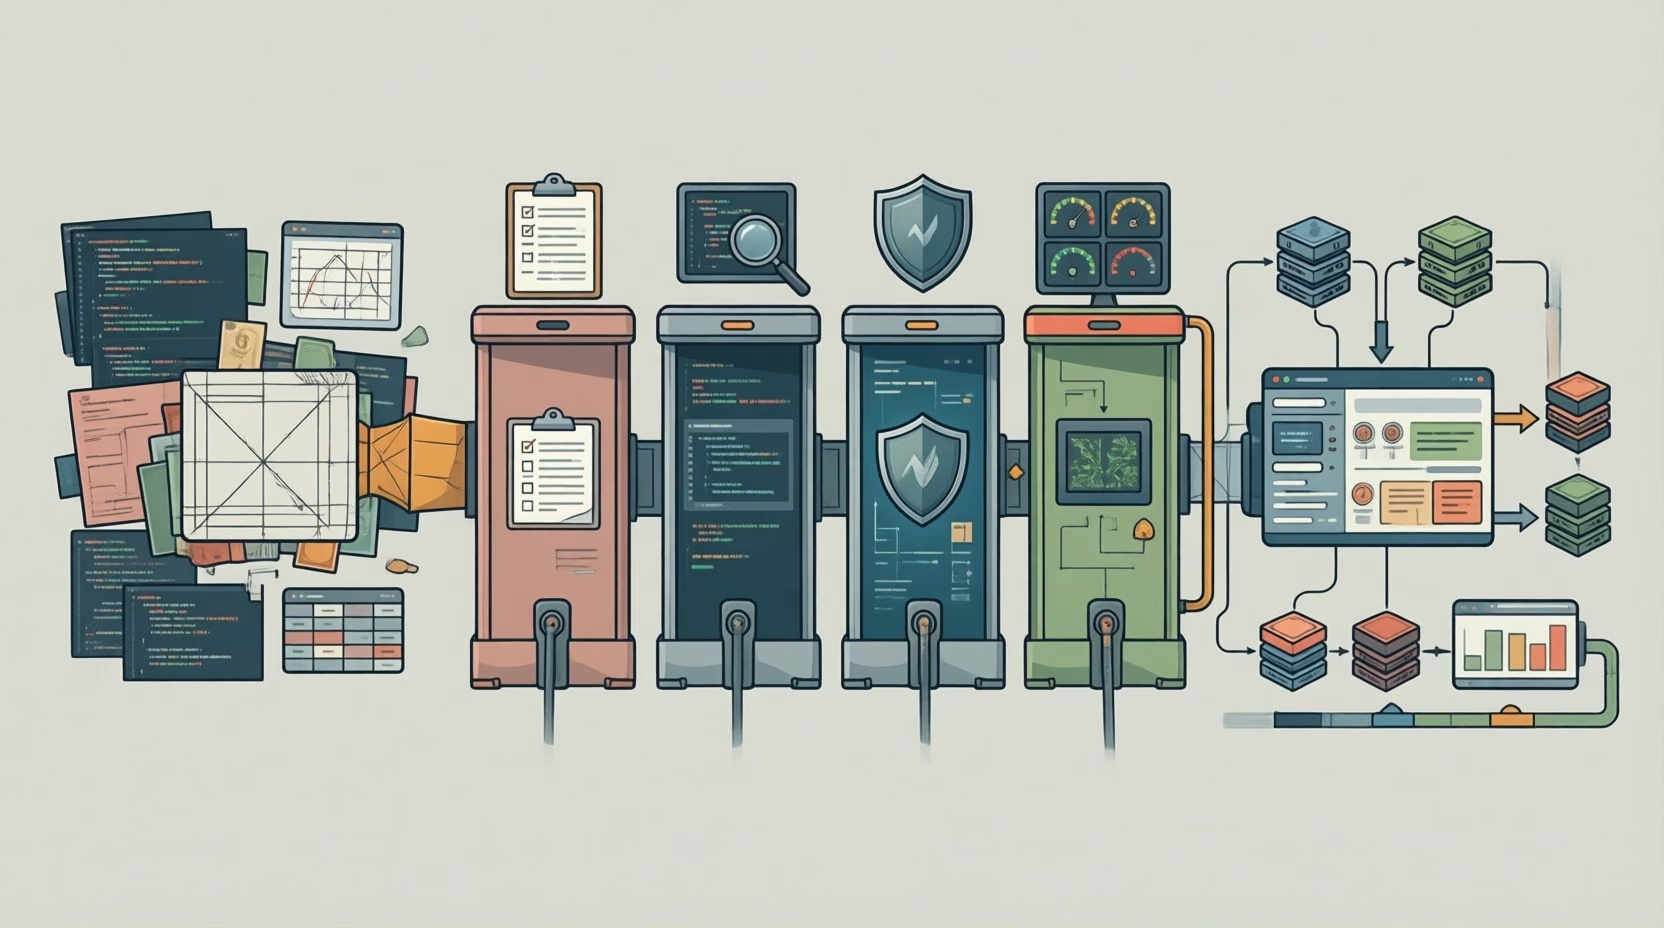
Illustration generated with FLUX.1 [schnell] via Cloudflare Workers AI.
SHARE

I wrote a note on how to combine multiple predictors with only marginally higher than baseline accuracy to construct an ensemble predictor that is much more accurate, via unanimous voting. It has a few simple formulas which don’t work in html so here it is in pdf format.

I’m a bit worried because it looks much more mathematically complicated than it is (it’s only simple fraction arithmetic and the most basic probability) and because it has no pictures. There is a table at least. It’s written to be as intuitive as possible though, like everything else.
I’d like to hear if anyone’s using techniques like this.

Share This Article
Facebook Pinterest LinkedIn
Share

Follow us on Facebook

Latest News

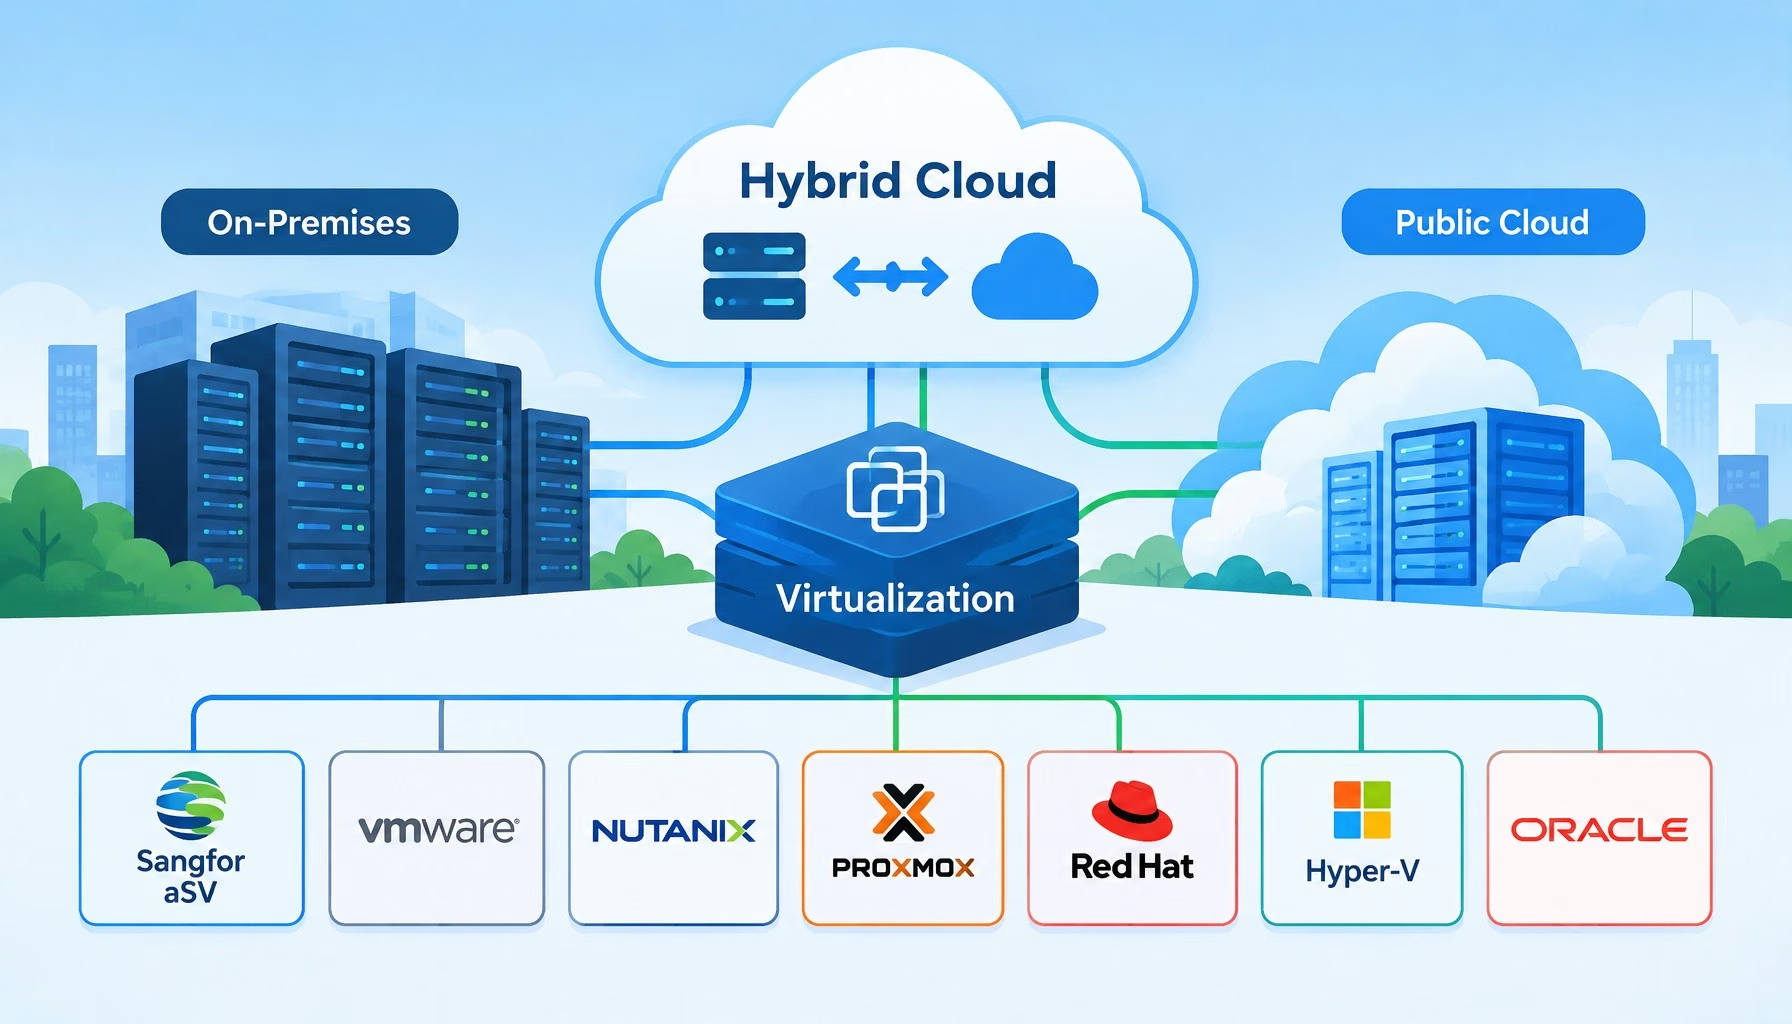
Flat editorial illustration: The article's core relationship is the hypervisor as the abstraction layer that makes hybrid cloud p
7 Best Virtualization Platforms for Hybrid Cloud Environments
Big Data
Flat editorial illustration: The article's core relationship is between aggregated workplace data (occupancy, environmental, feed
How Businesses Can Use Workplace Data to Create Better Office Environments
Big Data Business Intelligence Exclusive
Flat editorial illustration: The article's core relationship is the engineering transition from an AI prototype to a production-r
From AI Prototype to Production: Observability and Scalability Requirements for Data-Heavy SaaS Applications
Artificial Intelligence Exclusive
Preparing Data Systems and Governance for a Scaling Global Gaming Brand -- AI-generated illustration
Preparing Data Systems and Governance for a Scaling Global Gaming Brand
Big Data Infographic

Stay Connected

1.2KFollowersLike
33.7KFollowersFollow
222FollowersPin

You Might also Like

Creating a Business Intelligence Culture
Best PracticesBusiness IntelligenceCulture/LeadershipPolicy and Governance

Creating a Business Intelligence Culture

9 Min Read
Al Ries talks to Tom H. C. Anderson about Marketing…
Business IntelligenceCRMData MiningPredictive Analytics

Al Ries talks to Tom H. C. Anderson about Marketing…

18 Min Read
How to build a dashboard that your executives will love
Best PracticesBusiness Intelligence

How to build a dashboard that your executives will love

14 Min Read
Dear IT: A Letter from Your Business Users
Business Intelligence

Dear IT: A Letter from Your Business Users

6 Min Read

SmartData Collective is one of the largest & trusted community covering technical content about Big Data, BI, Cloud, Analytics, Artificial Intelligence, IoT & more.

5 Great Tips for Using Data Analytics for Website UX
Big Data
ai chatbot
How AI Website Chatbots Improve Customer Support and Lead Generation
Chatbots Exclusive

Quick Link

  • About
  • Contact
  • Privacy
Follow US
© 2008-26 SmartData Collective. All Rights Reserved.
Welcome Back!

Sign in to your account

Username or Email Address
Password

Lost your password?