We use cookies, including third-party cookies from Google to serve personalized ads through AdSense, to operate this site and understand how it is used. By continuing to browse, you accept this use. See our Privacy Policy and Terms of Use for details, including how to opt out of personalized advertising.
Accept
SmartData CollectiveSmartData Collective
  • Analytics
    AnalyticsShow More
    chatgpt image jul 21, 2026, 04 34 30 pm
    4 Core Benefits of Predictive Maintenance after Vibration Analysis
    10 Min Read
    How Does Data Mining Boost Customer Satisfaction in Logistics? Harnessing Analytics for Results -- AI-generated illustration
    How Does Data Mining Boost Customer Satisfaction in Logistics? Harnessing Analytics for Results
    11 Min Read
    chatgpt image jul 13, 2026, 04 23 45 pm
    How Data Analytics Helps Companies Improve User Engagement
    19 Min Read
    chatgpt image jul 13, 2026, 03 59 46 pm
    How Data Analytics Improves Multi-Location Search Strategies
    10 Min Read
    cybersecurity efforts
    How Behavioral Analytics and AI Are Redefining Cybersecurity for Boca Raton Businesses
    14 Min Read
  • Big Data
  • BI
  • Exclusive
  • IT
  • Marketing
  • Software
Search
© 2008-25 SmartData Collective. All Rights Reserved.
Reading: Entry Point: Architecture or Crumbling Foundation
Share
Notification
Font ResizerAa
SmartData CollectiveSmartData Collective
Font ResizerAa
Search
  • About
  • Help
  • Privacy
Follow US
© 2008-23 SmartData Collective. All Rights Reserved.
SmartData Collective > Big Data > Data Mining > Entry Point: Architecture or Crumbling Foundation
Data MiningData Warehousing

Entry Point: Architecture or Crumbling Foundation

DataQualityEdge
DataQualityEdge
3 Min Read
Entry Point: Architecture or Crumbling Foundation
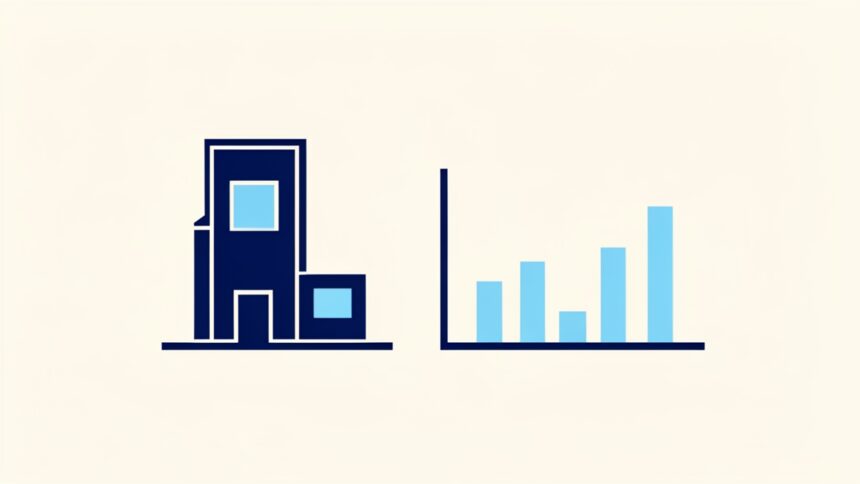
Illustration generated with FLUX.2 [klein 4B] via Cloudflare Workers AI.
SHARE

Let us talk for a moment about architecture.

Good architecture is built to last, to withstand the elements and the test of time. Good data architecture will allow you to extract data quickly, will help prevent data errors from occurring, and promote easy integration of future data assets.

With bad architecture, the following will persist like vermin in your basement:

  1. Data retrieval times will increase
  2. Data retrieval will become more difficult
  3. The integration and migration of projects will become cumbersome
  4. The creation and spread of bad data will be more likely

Soon the walls around you will begin to crumble as more and more data becomes questionable. Your users will question the data, and eventually your system will become synonymous with the term “poor data quality.”

More Read

Business (NOT) as Usual: 3 Big Business Intelligence Predictions for 2015
Operational decision making as a corporate asset
Metrics and Tools for Social Media Analysis
How A Data Mining Approach For Search Engine Optimization Works
Twitter and Text Analysis to Help You Surf Through Traffic

When building your data warehouse, remember to:

  1. Ensure you size it properly and measure future capacity for continuous growth
  2. If bad data does occur, have your data analysts cleanse it; and don’t build overly complicated data models — remember the KISS principle
  3. Improve speed to delivery and reaction time
  4. Improve query and data retrieval times

When defining your architecture and/or database system remember the following steps to help prevent bad architecture from occurring:

  1. Define the objective of the data warehouse
  2. Research the data and datasets (understand the business and its processes)
  3. Design the data model
  4. Define the database relationships
  5. Define rules, triggers and constraints
  6. Create views and/or reports
  7. Implement it.
TAGGED:architecturedata quality
Share This Article
Facebook Pinterest LinkedIn
Share

Follow us on Facebook

Latest News

Analyst points at colorful circular data dashboard on screen - information technology business metrics
How Fragmented Workplace Tech Undermines Reliable Business Metrics and Reporting
Cloud Computing Exclusive Infographic IT
Using Multi-Source Data and Analytics to Detect Operational Drift Across Franchise Networks -- AI-generated illustration
Using Multi-Source Data and Analytics to Detect Operational Drift Across Franchise Networks
Exclusive Infographic
Beyond The First Impression: The Long-Lasting Impact Of Sensory Marketing -- AI-generated illustration
Beyond The First Impression: The Long-Lasting Impact Of Sensory Marketing
Infographic Marketing
The Infrastructure Gap Slowing Data Center Growth -- AI-generated illustration
The Infrastructure Gap Slowing Data Center Growth
Big Data Cloud Computing Exclusive Infographic IT

Stay Connected

1.2KFollowersLike
33.7KFollowersFollow
222FollowersPin

You Might also Like

Which came first, the Data Quality Tool or the Business Need?
Data Quality

Which came first, the Data Quality Tool or the Business Need?

8 Min Read
Quality Control Tips for Data Collection with Drone Surveying
Data Collection

Quality Control Tips for Data Collection with Drone Surveying

9 Min Read
Information Theory Approach to Data Quality and MDM
Uncategorized

Information Theory Approach to Data Quality and MDM

15 Min Read
Sun Tzu and the Art of Data Quality (Part 3)
Uncategorized

Sun Tzu and the Art of Data Quality (Part 3)

5 Min Read

SmartData Collective is one of the largest & trusted community covering technical content about Big Data, BI, Cloud, Analytics, Artificial Intelligence, IoT & more.

How To Get An Award Winning Giveaway Bot
Big Data Chatbots Exclusive
5 Great Tips for Using Data Analytics for Website UX
Big Data

Quick Link

  • About
  • Contact
  • Privacy
Follow US
© 2008-26 SmartData Collective. All Rights Reserved.
Welcome Back!

Sign in to your account

Username or Email Address
Password

Lost your password?