We use cookies, including third-party cookies from Google to serve personalized ads through AdSense, to operate this site and understand how it is used. By continuing to browse, you accept this use. See our Privacy Policy and Terms of Use for details, including how to opt out of personalized advertising.
Accept
SmartData CollectiveSmartData Collective
  • Analytics
    AnalyticsShow More
    Flat editorial illustration: The article is about joining public web signals with internal business metrics so BI teams can inter
    Alternative Data in BI: Bringing Public Web Data Into Your Dashboards
    23 Min Read
    Flat editorial illustration: The article contrasts passive follower totals with a behavioral path from attention and trust to cli
    Creator Analytics Beyond Follower Count: Seven Metrics That Measure Audience Behavior
    11 Min Read
    Flat editorial illustration: The article connects AI and marketing analytics with managerial judgment grounded in consumer behavi
    How an Online MBA in Marketing Connects AI and Data Analytics
    11 Min Read
    What Kind of Problem-Solving Distinguishes Data Analysts From Software Engineers -- AI-generated illustration
    What Kind of Problem-Solving Distinguishes Data Analysts From Software Engineers
    7 Min Read
    chatgpt image jul 21, 2026, 04 34 30 pm
    4 Core Benefits of Predictive Maintenance after Vibration Analysis
    10 Min Read
  • Big Data
  • BI
  • Exclusive
  • IT
  • Marketing
  • Software
Search
© 2008-25 SmartData Collective. All Rights Reserved.
Reading: Analysts Realize There is A Downturn!
Share
Notification
Font ResizerAa
SmartData CollectiveSmartData Collective
Font ResizerAa
Search
  • About
  • Help
  • Privacy
Follow US
© 2008-23 SmartData Collective. All Rights Reserved.
SmartData Collective > Uncategorized > Analysts Realize There is A Downturn!
Uncategorized

Analysts Realize There is A Downturn!

RickSherman
RickSherman
4 Min Read
Analysts Realize There is A Downturn!
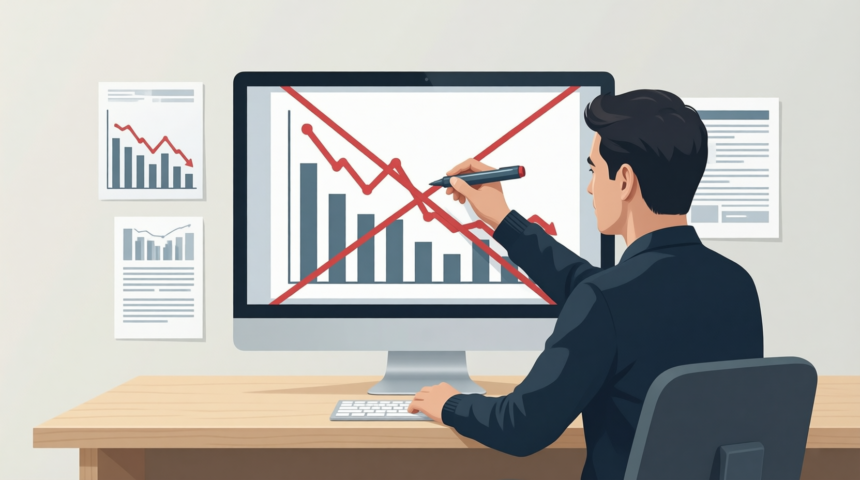
Illustration generated with Qwen Image.
SHARE

The Business Intelligence (BI) Index was down 3.96% today, -33.0% year-to-date (YTD) and stocks within the index are down an average of 43.9% from their 52 week highs. This compares the iShares S&P GSTI Software Index Fund(IGV)  -32.1%, YTD and off 35.0% from its 52 week high. The BI Index had been slightly beating the IGV index earlier in the year but the latest downdraft in the market has pulled the BI index below the IGV.

The YTD performance of the major indices (as of today’s 10/7 US markets close): Dow -28.8%, S&P 500 -32.2% and Nasdaq Composite -33.8%. The BI Index and IGV are both in the range of these indices.

With the deteriorating expectations on corporate spending, many financial and industry analysts recently are lowering IT spending estimates for the remainder of this year and through next year. You might not have heard there is an economic crisis or slowdown but the analysts have keenly picked up on this phenomenon and are revising estimates.

Consensus has not been reached on the macro impact on IT budgets or on the specific impacts on hardware, software, services and IT employment. In the first half of the year the impact on IT budgets was largely confined to financial services but economic concerns have expanded to both consumer and corporate spending thus touching many industries.
For most of the year there was the perception that tech companies selling overseas would be able to avoid a US-only recession. As global recession concerns rise that perceived cushion has disappeared and with it tech stocks have been hit hard recently by the Bear.

More Read

Schrödinger's Data Quality
Schrödinger’s Data Quality
3 Ingenious Use Cases for Business Intelligence Tools
IDE and Debugging Function Comparison Between esProc, Perl and Python
Should Apple be more open?
Largest HIPAA Breach Ever: Hackers Steal Data on 4.5 Million Community Health Systems Patients

Accompanying reductions in overall IT spending estimates and decreased expectations for specific companies, financial analysts have been downgrading stocks and lowering their price targets. This is certainly appropriate and expected considering the degrading economic conditions.

These downgrades and future upgrades (when the Bull reemerges), though, seem to lag (often significantly) industry and stock movements. A downgrade would have been much more useful to investors before, or at least early in the cycle, an industry group has decreased 30% in value and individual stocks lose more than 50%. Likewise, do not be surprised if the eventual upgrades occur after the industry and individual stocks have already made significant moves higher.

I am not suggesting any way to improve the readings financial analysts get from their crystal ball. They provide a great service and insight into the industry. What I am suggesting is that you do not rely on solely on buy or sell ratings since they historically lag market and stock performance. It is comforting to have that Strong Buy rating when you buy that overpriced stock but it not likely to change to a Sell rating until well after most of your investment is lost. Do your homework.

fyi: The index is calculated on an equal-weight representation based on closing prices as of 12/31/07.


Share This Article
Facebook Pinterest LinkedIn
Share

Follow us on Facebook

Latest News

Flat editorial illustration: The article is about joining public web signals with internal business metrics so BI teams can inter
Alternative Data in BI: Bringing Public Web Data Into Your Dashboards
Big Data Business Intelligence Exclusive Web Analytics
Flat editorial illustration: A SaaS-editorial scene showing product usage, support patterns, and renewal feedback informing a fle
Using Product Usage Analytics and Support Data to Build a B2B Product Roadmap
Business Intelligence Infographic
From Hiring To Payroll: Managing HR Data Across Business Systems -- AI-generated illustration
From Hiring To Payroll: Managing HR Data Across Business Systems
Big Data Business Intelligence Infographic
Flat editorial illustration: The article is about automating the collection, preparation, and delivery of marketing data across p
From Data to Dashboards: 5 Marketing Reporting Automation Software Picks
Big Data Business Intelligence Exclusive

Stay Connected

1.2KFollowersLike
33.7KFollowersFollow
222FollowersPin

You Might also Like

Data Cleansing vs Data Maintenance: Which One Is Most Important?
Uncategorized

Data Cleansing vs Data Maintenance: Which One Is Most Important?

5 Min Read
Capturing the Financial Facts
Uncategorized

Capturing the Financial Facts

4 Min Read
Using R to analyze lifetimes of business systems
Uncategorized

Using R to analyze lifetimes of business systems

5 Min Read
Data Within and Data Without
Uncategorized

Data Within and Data Without

3 Min Read

SmartData Collective is one of the largest & trusted community covering technical content about Big Data, BI, Cloud, Analytics, Artificial Intelligence, IoT & more.

5 Great Tips for Using Data Analytics for Website UX
Big Data
Artificial Intelligence for eCommerce: A Closer Look
Artificial Intelligence

Quick Link

  • About
  • Contact
  • Privacy
Follow US
© 2008-26 SmartData Collective. All Rights Reserved.
Welcome Back!

Sign in to your account

Username or Email Address
Password

Lost your password?