Cookies help us display personalized product recommendations and ensure you have great shopping experience.

By using this site, you agree to the Privacy Policy and Terms of Use.
Accept
SmartData CollectiveSmartData Collective
  • Analytics
    AnalyticsShow More
    image fx (67)
    Improving LinkedIn Ad Strategies with Data Analytics
    9 Min Read
    big data and remote work
    Data Helps Speech-Language Pathologists Deliver Better Results
    6 Min Read
    data driven insights
    How Data-Driven Insights Are Addressing Gaps in Patient Communication and Equity
    8 Min Read
    pexels pavel danilyuk 8112119
    Data Analytics Is Revolutionizing Medical Credentialing
    8 Min Read
    data and seo
    Maximize SEO Success with Powerful Data Analytics Insights
    8 Min Read
  • Big Data
  • BI
  • Exclusive
  • IT
  • Marketing
  • Software
Search
© 2008-25 SmartData Collective. All Rights Reserved.
Reading: So What is Business Analytics & Its Various Components?
Share
Notification
Font ResizerAa
SmartData CollectiveSmartData Collective
Font ResizerAa
Search
  • About
  • Help
  • Privacy
Follow US
© 2008-23 SmartData Collective. All Rights Reserved.
SmartData Collective > Analytics > Predictive Analytics > So What is Business Analytics & Its Various Components?
AnalyticsBusiness IntelligencePredictive AnalyticsText Analytics

So What is Business Analytics & Its Various Components?

Sandeep Raut
Sandeep Raut
4 Min Read
Business Analytics
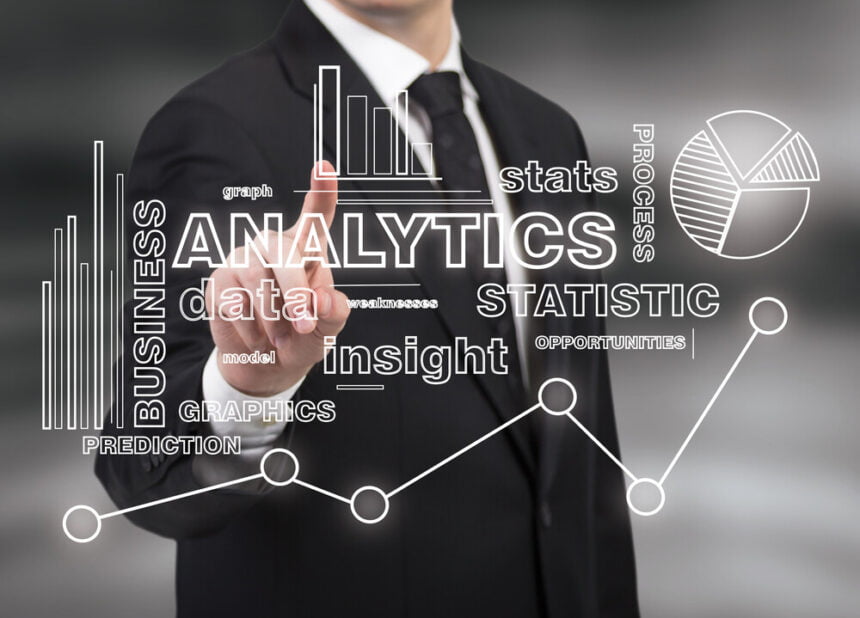
Shutterstock Licensed Photo - By ImageFlow
SHARE
In the first post I talked about why Analytics is required more than ever now.
In the first post I talked about why Analytics is required more than ever now. In this post let us discuss, what is it all about & what are the typical components of Analytics.
Let us start with definition of Analytics. There are multiple definitions available but as our focus is on Simplified-Analytics, I feel the one below will help you understand better.
Business Analytics is the use of statistical tools & technologies to:
  • Find patterns in your data for further analysis e.g. product association
  • Find out outliers from the huge data points e.g. fraud detection
  • Identify relationships within the key data variables for further prediction e.g. next likely purchase from the Customer
  • Provide insights as to what will happen next e.g. which of the Customers are leaving us
  • Gain the competitive advantage. 
So a more detailed comparison with Business Intelligence will help you understand better.

Business Intelligence
Business Analytics
What does it do?
Reports on what happened in the past or what is happening in now, in current time.
Investigate why it happened & predict what may happen in future.
How is it achieved?
  • Basic querying and reporting
  • OLAP cubes, slice and dice, drill-down
  • Interactive display options – Dashboards, Scorecards, Charts, graphs, alerts
·    Applying statistical and mathematical techniques
·    Identifying relationships between key data variables
·    Reveal hidden patterns in data
What does your business gain?
  • Dashboards with “how are we doing” information
  • Standard reports and preset KPIs
  • Alert mechanisms when something goes wrong 
·    Response to “what do we do next?”
·    Proactive and planned solutions for unknown circumstances
·    The ability to adapt and respond to changes and challenges

Now that you know the difference between BI & BA, let us discuss the typical components in Analytics.
There are 6 major components or categories in any analytics solution.
  • Data Mining – Create models by uncovering previously unknown trends and patterns in vast amounts of data e.g. detect insurance claims frauds, Retail Market basket analysis.  
There are various statistical techniques through which data mining is achieved. 
  •  
    • Classification ( when we know on which variables to classify the data e.g. age, demographics) 
    • Regression 
    • Clustering ( when we don’t know on which factors to classify data) 
    • Associations & Sequencing Models
  • Text Mining – Discover and extract meaningful patterns and relationships from text collections e.g. understand sentiments of Customers on social media sites like Twitter, Face book, Blogs, Call center scripts etc. which are used to improve the Product or Customer service or understand how competitors are doing.
  • Forecasting – Analyze & forecast processes that takes place over the period of time e.g. predict seasonal energy demand using historical trends, Predict how many ice creams cones are required considering demand
  • Predictive Analytics – Create, manage and deploy predictive scoring models e.g. Customer churn &  retention, Credit Scoring, predicting failure in shop floor machinery
  • Optimization – Use of simulations techniques to identify scenarios which will produce best results e.g. Sale price optimization, identifying optimal Inventory for maximum fulfillment & avoid stock outs
  • Visualization – Enhanced exploratory data analysis & output of modeling results with highly interactive statistical graphics
Hope this has helped you get the clarity on what is Analytics.
Next post I will cover how various business verticals are using Analytics.
TAGGED:business analytics
Share This Article
Facebook Pinterest LinkedIn
Share
BySandeep Raut
Follow:
Founder & CEO at Going Digital - Digital Transformation, Data Science, BigData Analytics, IoT Evangelist

Follow us on Facebook

Latest News

image fx (2)
Monitoring Data Without Turning into Big Brother
Big Data Exclusive
image fx (71)
The Power of AI for Personalization in Email
Artificial Intelligence Exclusive Marketing
image fx (67)
Improving LinkedIn Ad Strategies with Data Analytics
Analytics Big Data Exclusive Software
big data and remote work
Data Helps Speech-Language Pathologists Deliver Better Results
Analytics Big Data Exclusive

Stay Connected

1.2kFollowersLike
33.7kFollowersFollow
222FollowersPin

You Might also Like

Analytics

How can CIOs Build Business Value with Business Analytics?

8 Min Read

Is Business Analytics Just Another Passing Fad?

4 Min Read
business intelligence benefits for companies trying to get through the pandemic
Business Intelligence

How BI Can Help Enterprises Overcome The Effects Of The Pandemic

6 Min Read

2010 – Old Decade, New Decade

6 Min Read

SmartData Collective is one of the largest & trusted community covering technical content about Big Data, BI, Cloud, Analytics, Artificial Intelligence, IoT & more.

giveaway chatbots
How To Get An Award Winning Giveaway Bot
Big Data Chatbots Exclusive
data-driven web design
5 Great Tips for Using Data Analytics for Website UX
Big Data

Quick Link

  • About
  • Contact
  • Privacy
Follow US
© 2008-25 SmartData Collective. All Rights Reserved.
Go to mobile version
Welcome Back!

Sign in to your account

Username or Email Address
Password

Lost your password?