Cookies help us display personalized product recommendations and ensure you have great shopping experience.

By using this site, you agree to the Privacy Policy and Terms of Use.
Accept
SmartData CollectiveSmartData Collective
  • Analytics
    AnalyticsShow More
    big data analytics in transporation
    Turning Data Into Decisions: How Analytics Improves Transportation Strategy
    3 Min Read
    sales and data analytics
    How Data Analytics Improves Lead Management and Sales Results
    9 Min Read
    data analytics and truck accident claims
    How Data Analytics Reduces Truck Accidents and Speeds Up Claims
    7 Min Read
    predictive analytics for interior designers
    Interior Designers Boost Profits with Predictive Analytics
    8 Min Read
    image fx (67)
    Improving LinkedIn Ad Strategies with Data Analytics
    9 Min Read
  • Big Data
  • BI
  • Exclusive
  • IT
  • Marketing
  • Software
Search
© 2008-25 SmartData Collective. All Rights Reserved.
Reading: Adventures in MOOC: Back to School
Share
Notification
Font ResizerAa
SmartData CollectiveSmartData Collective
Font ResizerAa
Search
  • About
  • Help
  • Privacy
Follow US
© 2008-23 SmartData Collective. All Rights Reserved.
SmartData Collective > Analytics > Adventures in MOOC: Back to School
AnalyticsBig Data

Adventures in MOOC: Back to School

DougLautzenheiser
DougLautzenheiser
4 Min Read
SHARE
learning how to use R language

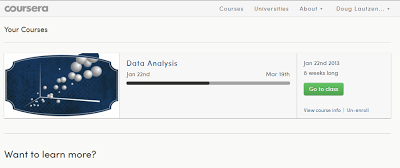
I am now in the homestretch of a Coursera MOOC that lasts eight weeks.

learning how to use R language

I am now in the homestretch of a Coursera MOOC that lasts eight weeks. At the five-week milestone of a Data Analysis course using the R statistical programming language, I have survived four weekly quizzes and the first written assignment. See my original posting for the back story.

Seriously, I almost didn’t take the very first quiz. It was that intimidating. But after passing three of them, I started to feel pretty good. Perhaps I was even ready for a sexy Data Scientist swagger.

But then a major setback shook my confidence: I saw the Data Analysis written assignment. You had to download data, sift through it for associations, generate graphs, and write a paper. I fumbled with the data analysis for quite a while. I considered admitting defeat and just watching the lectures in the future. Mark it as an “audit” instead of a graded certificate.

I went to bed on Friday night thinking, “This is crazy! I don’t have the time for this stuff. This course isn’t that important.”

Luckily for my scholastic endeavors, by 6:30am the next morning my attitude had improved and I knocked out the assignment within four hours. What had stopped me the previous night was dirty data. The bums had made the data bad so that your first step needed to be to convert formats and clean things up. In the morning, I had the presence of mind to look through the course discussion forums and read the comments of other disgruntled students who had already commented on the dirty-data-trick. You see, in real life, you have to deal with dirty data. The teacher was making a point in the assignment.

Whoever thinks an online college course is easier than a “real” class sitting in a classroom is very mistaken. This is serious stuff.

One major issue with the assignment was timing. The teacher assigned it during Week 3, but I wouldn’t understand how to do it until after Week 4’s lectures and quiz. I finished the assignment before I knew what I was doing.

Because there are thousands of students, the teacher cannot grade the assignments. Instead, he needs the students to grade each other according to a standard Yes/No rubric where each evaluation question is worth zero to five points. Each student has to evaluate the work of four peers or receive a 20% deduction in their assignment grade.

After I submitted my assignment and started on the peer reviews, I immediately got that “oh crap” feeling. Looking at the work of others, I started to gain a better insight into what the teacher might have wanted. Compared to theirs, my data analysis seemed pretty simple. At the time, I didn’t understand how to use R to program a linear model with confounding, interacting variables. Confound it!

Oh well, my data analysis report was formatted nicely and the R graphs looked pretty; I can only hope my peer graders will be gracious and overlook my simple statistics. To get the positive karma flowing, I gave all of my peers perfect scores. 

TAGGED:analyticscourseradata analysisData SciencemodelingMOOConline educationr language
Share This Article
Facebook Pinterest LinkedIn
Share

Follow us on Facebook

Latest News

AI role in medical industry
The Role Of AI In Transforming Medical Manufacturing
Artificial Intelligence Exclusive
b2b sales
Unseen Barriers: Identifying Bottlenecks In B2B Sales
Business Rules Exclusive Infographic
data intelligence in healthcare
How Data Is Powering Real-Time Intelligence in Health Systems
Big Data Exclusive
intersection of data
The Intersection of Data and Empathy in Modern Support Careers
Big Data Exclusive

Stay Connected

1.2kFollowersLike
33.7kFollowersFollow
222FollowersPin

You Might also Like

Predictive Analytics: 8 Things to Keep in Mind (Part 7)

6 Min Read
power of analytics
Analytics

Harnessing the Power of Analytics For Direct-to-Consumer Businesses

6 Min Read
DNA and criminal data usage
Big DataExclusive

The 5 Most Important Criminal DNA And Crime Data Sources

9 Min Read

New Trends in BI, Analytics and Social Media

9 Min Read

SmartData Collective is one of the largest & trusted community covering technical content about Big Data, BI, Cloud, Analytics, Artificial Intelligence, IoT & more.

ai chatbot
The Art of Conversation: Enhancing Chatbots with Advanced AI Prompts
Chatbots
ai in ecommerce
Artificial Intelligence for eCommerce: A Closer Look
Artificial Intelligence

Quick Link

  • About
  • Contact
  • Privacy
Follow US
© 2008-25 SmartData Collective. All Rights Reserved.
Go to mobile version
Welcome Back!

Sign in to your account

Username or Email Address
Password

Lost your password?