We use cookies, including third-party cookies from Google to serve personalized ads through AdSense, to operate this site and understand how it is used. By continuing to browse, you accept this use. See our Privacy Policy and Terms of Use for details, including how to opt out of personalized advertising.
Accept
SmartData CollectiveSmartData Collective
  • Analytics
    AnalyticsShow More
    chatgpt image jul 21, 2026, 04 34 30 pm
    4 Core Benefits of Predictive Maintenance after Vibration Analysis
    10 Min Read
    How Does Data Mining Boost Customer Satisfaction in Logistics? Harnessing Analytics for Results -- AI-generated illustration
    How Does Data Mining Boost Customer Satisfaction in Logistics? Harnessing Analytics for Results
    11 Min Read
    chatgpt image jul 13, 2026, 04 23 45 pm
    How Data Analytics Helps Companies Improve User Engagement
    19 Min Read
    chatgpt image jul 13, 2026, 03 59 46 pm
    How Data Analytics Improves Multi-Location Search Strategies
    10 Min Read
    cybersecurity efforts
    How Behavioral Analytics and AI Are Redefining Cybersecurity for Boca Raton Businesses
    14 Min Read
  • Big Data
  • BI
  • Exclusive
  • IT
  • Marketing
  • Software
Search
© 2008-25 SmartData Collective. All Rights Reserved.
Reading: What’s The Difference between Data Scientists and Rocket Scientists?
Share
Notification
Font ResizerAa
SmartData CollectiveSmartData Collective
Font ResizerAa
Search
  • About
  • Help
  • Privacy
Follow US
© 2008-23 SmartData Collective. All Rights Reserved.
SmartData Collective > Analytics > What’s The Difference between Data Scientists and Rocket Scientists?
Analytics

What’s The Difference between Data Scientists and Rocket Scientists?

TalentAnalytics
TalentAnalytics
4 Min Read
What's The Difference between Data Scientists and Rocket Scientists?
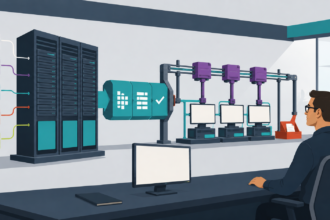
Illustration generated with Qwen Image.
SHARE

This post was written by Greta Roberts, CEO, Talent Analytics, Corp. on 18 July 2012. Comment below!

After attending several analytics conferences over the last month, I’m beginning to understand an important nuance about the community we call “analytics” worked by “analytics professionals” or “data scientists.”  It seems as if the defining boundary of our discipline is almost always that we data scientists apply ourselves to business, organizational, and market data.

This post was written by Greta Roberts, CEO, Talent Analytics, Corp. on 18 July 2012. Comment below!

After attending several analytics conferences over the last month, I’m beginning to understand an important nuance about the community we call “analytics” worked by “analytics professionals” or “data scientists.”  It seems as if the defining boundary of our discipline is almost always that we data scientists apply ourselves to business, organizational, and market data.

More Read

Value of Decommissioning Legacy Systems
5 Data-Driven Steps to Improve Customer Conversion Rates
7 Ways Data Monetization is Changing the Information Technology Job Market
Tips for Change Leaders – How to Show Your Impact
New Trends in BI, Analytics and Social Media

The important nuance?  Businesses, organizations, and markets all involve interactions between people.  Always.

Several other domains use very similar computational techniques to look at purely physical things – the hard sciences and engineering.  As an example, astrophysicists or metallurgists may use the same statistical programs as data scientists, but their world is very different.  Their data does not involve humans.  For example, the electrical lifespan of a battery doesn’t vary with human sentiments, though sometimes it may seem that way.

Since a data scientist’s work is typically in the service of learning about, bringing value to, and bringing change to an organization, we have to deal with people.  It’s not about the size of our datasets – compare your data to Computational Fluid Dynamics data someday – but it’s that we are looking at these sometimes fickle, non-linear, yet often-predictable critters called employees or buyers or sellers.

Finance, in particular, is famous for “physics envy,” leading to very mathematical, yet sometimes fatally flawed models of market and ultimately human behavior.  In the Analytics business, no matter how many physics Ph.D.’s we hire, our analytics professionals often only get one pass at the data – we can’t repeat experiments as if we are Edison looking for a light bulb filament.

Just because our ultimate subject matter (people) maybe influenced by Madonna one decade and Lady Gaga the next, does not make them impossible to model, analyze, and even predict.  And since only people do the work and the buying, this analysis is very valuable with even small correlations.

Maybe this seems obvious, but I think it can sometimes be easy to fall into thinking about the “market” or “transactions” or “attrition” or “performance” in a more mechanistic way that forgets about the involvement of people making a Data Scientist’s work far more complicated than predicting the airflow over a wing.

The above nuance feels like an important one, to learn and to pass along as it highlights the unique, powerful and human side of our work.  This concept may be lost in the seeming trivia of scanning social media text, but in fact the closer to humanity we are, the closer we are to being Data Scientists.

Originally published by International Institute for Analytics.

Greta Roberts is a Faculty Member of the IIA and CEO of Talent Analytics, Corp. Follow her on twitter @GretaRoberts.

TAGGED:big dataData Scientistpredictive analytics
Share This Article
Facebook Pinterest LinkedIn
Share

Follow us on Facebook

Latest News

Illustration of mobile analytics dashboards with ad performance charts connected to backend databases
11 Best Sisense Alternatives for Embedded Analytics
Business Intelligence Exclusive
Analyst points at colorful circular data dashboard on screen - information technology business metrics
How Fragmented Workplace Tech Undermines Reliable Business Metrics and Reporting
Cloud Computing Exclusive Infographic IT
Using Multi-Source Data and Analytics to Detect Operational Drift Across Franchise Networks -- AI-generated illustration
Using Multi-Source Data and Analytics to Detect Operational Drift Across Franchise Networks
Exclusive Infographic
Beyond The First Impression: The Long-Lasting Impact Of Sensory Marketing -- AI-generated illustration
Beyond The First Impression: The Long-Lasting Impact Of Sensory Marketing
Infographic Marketing

Stay Connected

1.2KFollowersLike
33.7KFollowersFollow
222FollowersPin

You Might also Like

3 Ways Big Data Is Bringing SEO Out of The Stone Age
Big DataExclusive

3 Ways Big Data Is Bringing SEO Out of The Stone Age

7 Min Read
Big Data converging Data and Content
Business IntelligenceExclusive

Big Data converging Data and Content

5 Min Read
Is Big Data Failing?
Analytics

Is Big Data Failing?

5 Min Read
Big Data and Predictive Analytics in Video Games
AnalyticsPredictive Analytics

Big Data and Predictive Analytics in Video Games

2 Min Read

SmartData Collective is one of the largest & trusted community covering technical content about Big Data, BI, Cloud, Analytics, Artificial Intelligence, IoT & more.

Artificial Intelligence for eCommerce: A Closer Look
Artificial Intelligence
The Art of Conversation: Enhancing Chatbots with Advanced AI Prompts
Chatbots

Quick Link

  • About
  • Contact
  • Privacy
Follow US
© 2008-26 SmartData Collective. All Rights Reserved.
Welcome Back!

Sign in to your account

Username or Email Address
Password

Lost your password?