In the previous post we discussed the first steps necessary to understand what consumers write in their Tweets regarding their recent visit to a shopping Mall. In this post we will see how from this information Marketeers are able to understand spending patterns, know what consumers liked about their visit to a shopping Mall and know what is important for consumers.
In the previous post we discussed the first steps necessary to understand what consumers write in their Tweets regarding their recent visit to a shopping Mall. In this post we will see how from this information Marketeers are able to understand spending patterns, know what consumers liked about their visit to a shopping Mall and know what is important for consumers. According to Dr Dimitriadis who I teamed up with this analysis, important things to look at include (list not exhaustive) :
– spending patterns and situations (when, what and with whom people spend money)
– tenant mix preference (which products people like to buy and what else / new they want)
– experience evaluation (safety, availability of stores / products, cleanliness etc)
– perception of shopping mall communications (what people think about mall ads / messages)
Although there are many behaviors and opinions we could look for, let’s identify first what makes a consumer happy. To find this out we can analyze all Tweets containing a 🙂 (smilie) and find which keywords co-exist in these Tweets. Here are some of the results:
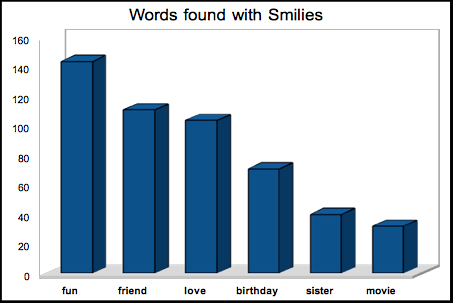
Apart from some typical words that suggest positive feelings, we also identify that ‘friend’ and ‘birthday’ are commonly found with smilies. It was found that consumers that shop for a birthday present or outfit use smilies often. Let’s see what happens with tweets that contain negative feelings 🙁 (frownie):
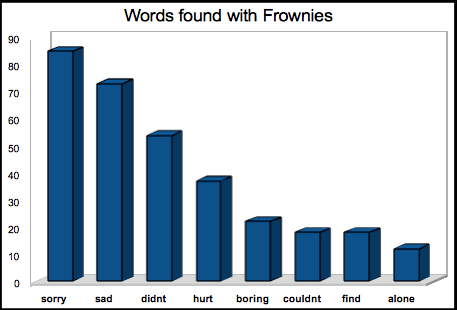
A frown appears more often when consumers do not find what they were looking for and also when they are at the mall alone. But what about what people hate when they visit a mall? A similar statistical test is performed to identify words which co-occur with the phrase “I hate it when.” These words are:
-Park
-People
-Walk
By looking at the actual tweets we can identify that many people hate it when:
1. a mall is very busy
2. it is difficult to park at the mall
3. people in front walk at a much slower pace (particularly older people)
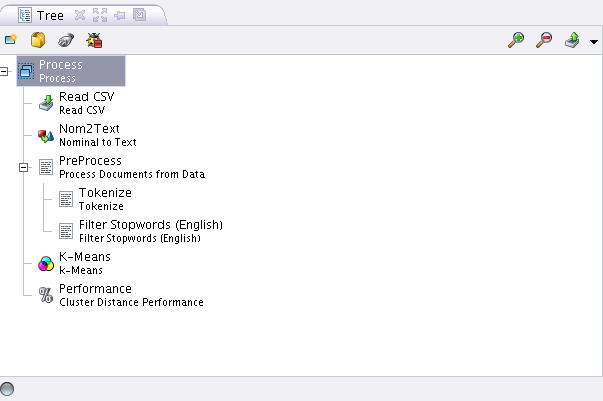
Next we can perform a cluster analysis for these tweets to identify common “thought clusters” of the consumers and their behavior. As an example i have used
Rapid-I to generate these clusters using the following setup:
Without getting into technical details (such as usage of tokenization, stop word removal and optimization of the process) by executing the stream shown above, a cluster analysis is run that identifies common consumer thoughts on their visit to the shopping Mall. Some of the clusters found are :
– People that state their intent to buy something
– Consumers which eat a meal and then go to the movies
– “saw a cute guy / girl looking at me”
– “I had a good time at the mall”
As discussed in previous posts, cluster analysis not only allows us to find common groups of behavior and thoughts but also to identify the frequency with which these behaviors and thoughts appear in consumer Tweets.
This behavior mining seems endless : In the same manner we can look for mentions of food, (for example see how often ‘Chinese’, ‘Indian’ or ‘Pizza’ appear in Tweets) or buying patterns (which items are discussed more frequently in “I want to buy” Tweets) or whether users feel more happy when they buy gifts for themselves or for others.


