

Big data can now predict when a high-value frequent flyer is unhappy with an airline loyalty program and is at greatest risk of switching their business to another carrier, and loyalty program.
That is the outcome of a six-month data analysis project which Travel Data Daily’s Mark Ross-Smith spearheaded using social media data and business intelligence resources from Microsoft Azure.
The study collected more than 400 million words and chatter on airline loyalty programs across internet sources, and, by using social user information, the data model utilizes a combination of cognitive text sentiment analysis and frequency pattern recognition, to accurately create a picture of an airline loyalty program member’s propensity to switch loyalty programs and book tickets with other airlines.
Data Predictions in Loyalty
In September 2015, Cathay Pacific’s Loyalty Program, Marco Polo announced changes to the airline’s flagship loyalty proposition, which was aimed at creating a more rewarding experience for frequent flyers, while bringing an array of new elite benefits and other enhancements to the program. As the largest loyalty program change in the past two years, we chose Marco Polo as the pilot program to validate the findings and hypotheses.

Shortly after the program changes, Head of Loyalty of Marco Polo, Elaine Lee, told CX World that in some cases, members will need to fly more to retain their elite status. “Members will be able to earn club points from a wider range of fares, including discounted fare types that are currently not applicable to club status.”
Fundamentally, what this change translated to was a shift in status earn from the mid-high yield economy class fare, to force passengers to make a decision. Lower fare classes, and earn some club points (which previously did not earn any credit towards elite status), or purchase a flexible premium economy /business class or higher ticket in order to earn more club points.
The decision means frequent flyers were forced into one of two camps (deep discount economy fares – or into full fare business class). For years – Marco Polo had awarded no status earning for low fare class tickets, which means elite members were previously being trained to purchase mid-range economy tickets and higher in order to earn club recognition.
After the new program changes – all incentives to purchase mid-range economy fares were withdrawn, and in fact – dis-incentivized, and thus encouraging frequent flyers to purchase deep discount and low yield economy class tickets.
Interestingly, the average yield change on Cathay Pacific between 2015 and 2016 was down 9.2% and overall load factors down by 1.2%. Cathay Pacific attributes some of these to ‘decrease in premium cabin demand’1.
If Marco Polo had introduced propensity scoring values on each elite member, it would be possible to measure the direct financial impact the changes had on the bottom line, as the combination of scoring and softening yields in the high-end economy fare classes could be directly correlated for a measured financial overview of the program changes. Although a simplistic view, it could provide insight to validating the program model, which by our accounts, doesn’t appear to have been properly tested prior to program changes.
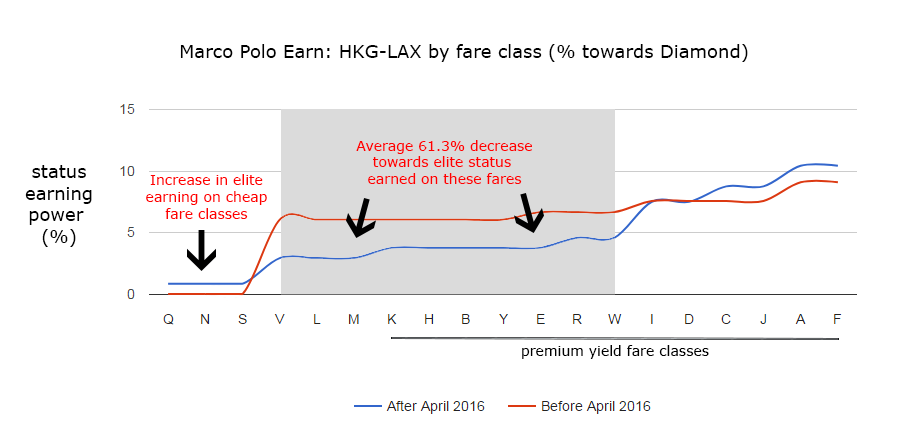
The Impact on 2015 Marco Polo Program Enhancements showing high-value economy class passengers earning up to 61.3% less towards status on each flight than under the previous program design. Fares in the highlighted zone now earn less % towards status, thus pushing frequent flyers into deep discount economy, or into full revenue business/first class (C, J, A, F).
Program Design & Member Tracking
To fully understand the material impact of the program changes using data and analytics, we set out to track the trends of what members were thinking and communicating. By tracking online cognitive sentiment activity on social media, we were able to gain understanding and insight to how Marco Polo members were talking about the program, and about their experiences with Cathay Pacific.
The net result of the sentiment analysis was that, if looking at our social media data as a whole, there is not a lot of change in member sentiment over the timeframe, and thus the deep insight required may not register on traditional tracking tools like Social Studio, Adobe, etc.
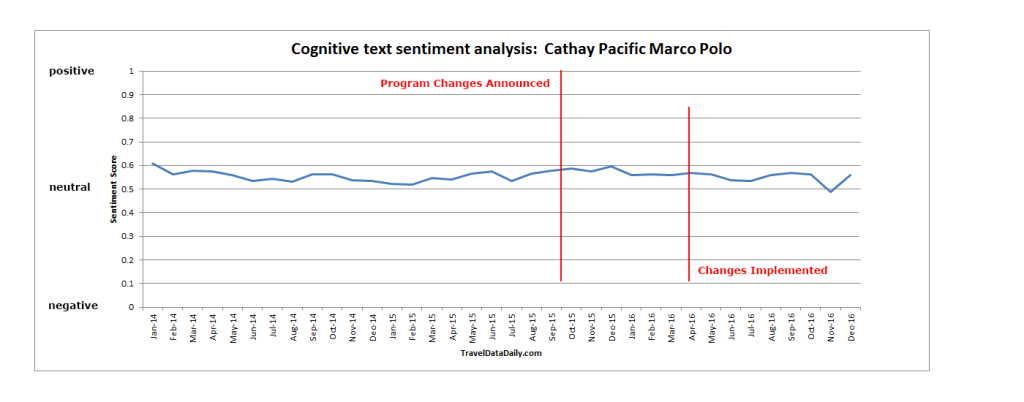
The general sentiment of the Marco Polo program remains fairly consistent when viewed as a whole.
Based on the message sentiment of social media users chatter, we began to look at patterns in how users talked about Marco Polo and Cathay Pacific to see if there was any correlation between the type of words – and their elite status level.
The first step is filtering out the noise and focus entirely on Gold and Diamond members.
Our data engine was able to train an initial data set of members which we knew the elite status level of, and what their elite status was over a 10-year period. With several basic machine learning algorithms, we used this trained data set and applied it to the full data set.
Understanding what a social user’s elite status was at the exact time they made a comment, posted a photo or had a poor experience is key to being able to predict their future actions. From the results, we were able to predict (>75% accuracy) what status level (Green, Silver, Gold, Diamond or Oneworld Status) the member held at any given point in time.
Next, we overlayed the cognitive text sentiment analysis data on top of the elite status information for each social user which we could predict. This allows for a richer and segmented view of how members were responding to the loyalty program changes and other market influencing factors at any point in time. The sentiment analysis trend becomes more aggressive when splitting down each post by status level, and there is a clear and significant change in pattern after the September 2015 Marco Polo program changes were announced.
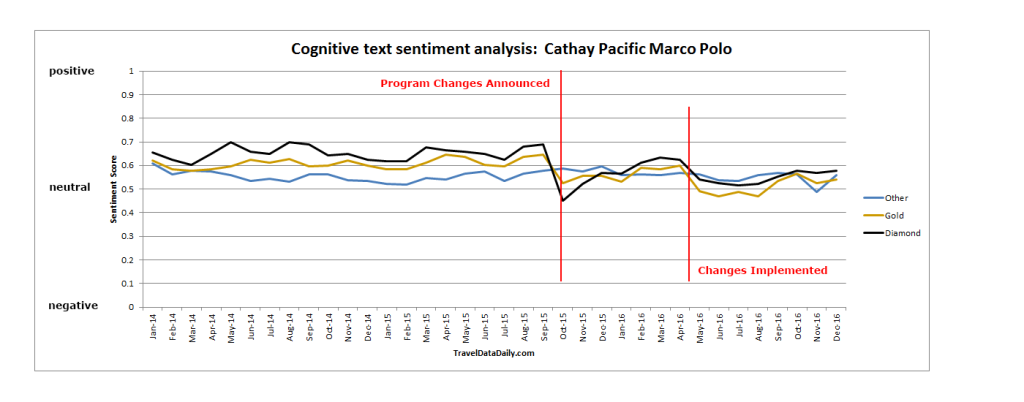
Net result shows an 11.9% decrease in positive sentiment by Gold and Diamond members of the loyalty program after the announcement. Sentiment from these members has not recovered to pre-program changes levels.
Predicting Loyalty Churn
The second data correlation we identified was in frequency and the subject of how loyalty members speak about airlines in their social feed.
Expanding our data set to include over 20 airlines and loyalty programs and more than 40 0million words, from 494,000users there are patterns between how a member talks about their ‘home’ airline and other airlines.
What we found was that when loyalty members who consistently talk about their home airline suddenly begin talking about another airline in a positive manner or asking questions related to another airline, our research suggests the propensity for this individual to book a flight or switch loyalty programs significantly increases.
Our data analysis indicates that members who match the profile of talking about other programs positively, while simultaneously speaking negatively about Marco Polo were highly likely to switch (churn) loyalty programs within 85 days of making the statements.
This type of churn risk analysis would be difficult for the Marco Polo team to identify as their internal data is transactional (has the user booked a flight recently? are they viewing their account online? current Asia Miles activity, etc.) It’s only after the loyalty member has already disengaged with the program that Marco Polo would be aware of the issue, at which time, it’s too late.
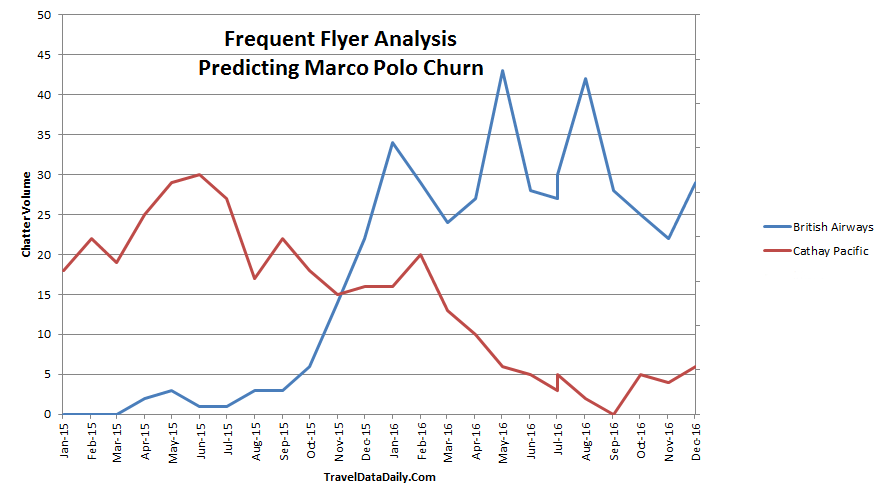
Example: A Cathay Pacific Marco Polo Diamond member who moved their business to British Airways. We can clearly see this members’ online social patterns and the point in which they switched programs in January 2016.
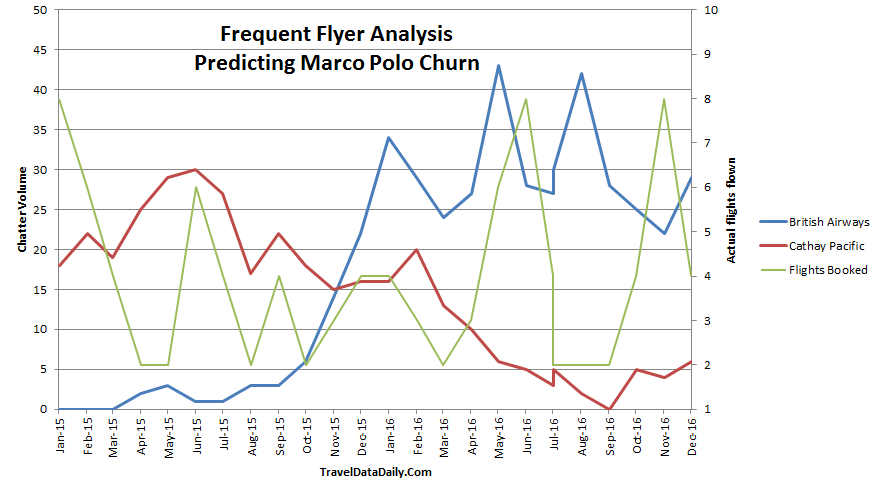
Overlaying actual transactional flight data on top of the Diamond members’ chatter volume displays no correlation between transactional flight bookings on Cathay Pacific Airways and their loyalty behavior. Based on the observation, Cathay Pacific could not accurately use member transactional data alone to predict loyalty churn.
Loyalty specialist and past executive at Virgin America and Velocity Frequent Flyer, Stuart Dinnis, told Travel Data Daily that “Loyalty programs need to join the 21st century and look beyond their own program transactional data.”
Share of Growth
Predicting churn away from the loyalty program becomes even more challenging when the airline does not have a clear understanding of the share of wallet they are capturing from each member.
For example, the Cathay Pacific Marco Polo team may see no decrease in air activity in many segments, but yet these same members may be increasing their spend and activity with competitor Singapore Airlines (who recently announced a $800 million investment in digitization, which is earmarked for “building a holistic database on its passengers, from which it will leverage data analytics and algorithms to derive insights on each passenger”.)
These are significant churn risk indicators, but without the means to capture analyze and action the intelligence, the perception and internal insight would be that since the member has consistent spend for X/years, then everything is fine, when in fact, the share of growth is in the red.
Looking only at internal transactional data for these purposes can be very dangerous for loyalty programs.
The underlying ‘must have’ data points in knowing the share of growth for each loyalty member is using data to create a full 360-degree view of members’ transactional and social value.
Overall key findings:
- Social media data can be used as an additional source to help predict when loyalty members are at risk of switching to another program or booking a flight with another airline.
- Social media data can identify high-value customers on many frequent flyer programs, and intelligence could be used to either retain their business or facilitate churn to a new program. Competing airlines could deploy counterintelligence tactics to source competitor’s high-value customers and poach them.
- Very little correlation between negative sentiment and churn among non-elite loyalty members that is: these customers tended not to speak negatively about Cathay Pacific before moving their business, and instead appear to quietly cease doing business with Cathay Pacific. The more vocal an elite loyalty program member is the greater chance of predicting their future business spend.
- Overall, the data identified 1,231 Silver, Gold and Diamond Marco Polo members who likely switched loyalty programs or increased their share of wallet with a competing airline/loyalty program between October 2015 – December 2016. A total of 13,172 potential status holding customers were identified, representing a 10.7% or 1 in 10 members identified as elite status holding members to have changed their loyalty. The estimated revenue impact to Cathay Pacific could top HK $62,000,000 in lost revenue annually.
- Loyalty program design plays a vital role in the success or failure of the value which the program is designed to bring the business. Ensuring members have the right benefits at the right time, at the right price point; especially for frequent flyer programs, as according to David Feldman’s analysis on FFP loyalty – the airline revenue driven by the FFP is far greater than either the cost of the program or the FFP business unit profit. Which suggests that poor loyalty program design can have massive revenue implications for the airline.
In Summary
Loyalty program data intelligence is becoming increasingly critical for frequent flyer programs to retain their competitive edge. The more that loyalty programs understand about member behavior, share of wallet, share of growth, propensity to engage in flight spend, credit card/partner activity, and what drives each loyalty member; the more personalized and profitable the loyalty program will become. BCG suggests travel companies which ‘get data personalization right’ will see a revenue shift of some $800 billion.
The Travel Data Daily Business Intelligence Engine continues to monitor social data intelligence from 20+ of the world leading airlines including Air Canada, Air France/KLM, Air New Zealand, Alaska, American Airlines, British Airways, Delta, Emirates, Etihad, Lufthansa, Qantas, Singapore Airlines, Thai and United.


