CRM and customer Master Data Management (MDM) applications only enable partial business insights. That’s right, and it makes no difference if we are talking cloud, on-premise or hybrid solutions. No matter how much or in which way we extend their data models, they are incapable of conveying complete customer stories.
CRM and customer Master Data Management (MDM) applications only enable partial business insights. That’s right, and it makes no difference if we are talking cloud, on-premise or hybrid solutions. No matter how much or in which way we extend their data models, they are incapable of conveying complete customer stories.

Paradoxically, the rigid, narrowly-focused databases at the center of CRM and customer MDM systems unwittingly constrict our view of customers. In truth, CRM’s core conceptual design dates back to late-1980s’ “sales force automation” apps. CRM and customer MDM have slowly turned our customer fixation into customer tunnel vision.
We are missing a rich body of information around the people, organizations and groups who are narrowly labelled, if not mislabeled, “accounts” and “contacts” in these apps, including:
- Their immediate connections to neighboring parties directly related to purchase transactions and interactions.
- Their separate connections when we engage them as accounts and contacts in multiple, completely different contexts [Added 04/19/2017]
- Their near and distant connections to peripherally related parties in varied selling, marketing, and service delivery contexts.
- Their corresponding connections in different operating contexts such as when they are also suppliers, partners, and whatever else, all at the same time. [Changed 04/19/2017]
Traversing customers’ contextualized network connections and corresponding data relationships afford endless possibilities to generate never before asked questions about customers. But the questions…and answers remain hidden away. We don’t see them. We don’t even know they exist in many cases, mainly because of our not-always beneficial obsession with being customer-centered.
This is where a graph database provides needed innovation to visualize, traverse and analyze the extensive interconnections among business constituents in multiple operating contexts.
Graph databases can help us to expand the boundaries of customer knowledge discovery and enrich our customer stories. These Not-Only-SQL (a.k.a “NoSQL”) style databases have shown their chops in applications such as recommendation engines, fraud detection and, of course, social networks. But their potential to dilate our view of customers in CRM and MDM remain largely untapped.
Graph databases can enable a network view of all connections among constituents in many business contexts, not simply a 360-degree customer focus. We’re talking deep and broad network awareness founded on transactions and interactions involving multiple parties in multiple roles.
To increase peripheral awareness, we need database capabilities more befitting of the contextualized heterarchy of business party instantiations. Graph databases with the commensurate search, visualization and analytical tools offset the shortcomings imposed by current CRM and MDM technologies and their aging database designs.
Contextualized Connections
Despite their intense customer-focus, and ironically because of it, CRM and MDM applications deliver incomplete customer knowledge and lack network awareness across multiple business contexts. The single customer view they render is largely confined to accounts and contacts, limiting our peripheral vision.
Focusing attention on accounts and contacts may have been useful in the 1990s. Not so today. It’s time to broaden our perspective.
The account and contact mindset of CRM and customer MDM not only fosters tunnel vision, it can distort our view. Consider these six fairly common but often unsupportable business scenarios that most notably yield unmanageable and unresolvable duplicates:
- A person is a contact at multiple, sometimes unrelated accounts.
- An account is related to other accounts besides an immediate corporate “Parent Account”.
- A contact person is related to contact persons at other, sometimes unrelated accounts.
- A contact person is also an account
- Parties designated as accounts and contacts have roles in other interactions and transactions unrelated to a customer context.
- Parties are falsely branded accounts and contacts because there is nothing else to label them.
Worse, semantics radically differ between applications. Simply compare an “account”, say, in SalesForce where it represents a person or organization, and in Oracle e-Business Suite, where it doesn’t. They are completely dissimilar entities. We often create a tangled mess when rationalizing and integrating data on a person, organization or group behaving in different roles in different business contexts.
Sometimes, for example, parties in Oracle behave as “accounts” in SalesForce. Sometimes they are suppliers in Oracle accounts payable and customers in Oracle accounts receivable. And sometimes they are just contacts in one or more systems. All at the same time. In each context, the person or organization may very well have different sets of connections and data relationships.
Here’s the bottom-line. Rendering contextualized, panoramic views of network connections among our business constituents…to create a complete customer story… are infeasible with current CRM and MDM capabilities. Attempts to force-fit an anachronistic account-contact design and display complex contextualized, network-type connections usually result in jumbled views of the relationships among constituent parties.
We need an epistemic graph that enables zooming in on a customer party’s neighboring connections in a single context and zooming out to visualize and traverse far-flung customer connections in multiple contexts. Let’s call it a contextualized master graph.
Simply put, a context-aware master graph affords the opportunity to expose obvious and not-so-obvious patterns of connections between constituent parties in multiple business situations. The result is unprecedented knowledge about individual customers and populations of them.
The Enterprise Connectome
A properly modeled master graph manifests the ontological, conceptual and physical foundation for an organization’s connectome. How? A master graph is the fundamental network component to search, view and traverse near and distant connections, represent data relationships in varied contexts and analyze patterns.
A master graph affords insight into relationships and patterns among members of populations consuming, having the potential to consume, and facilitating or influencing consumption of products and services. More than representing master data as a graph, a master graph enables panoramic, contextualized network views of connected business constituents and discovery of population segments.
Consider an ordinary transaction like renting a car through an airline after making a plane flight reservation (ignoring the provocative question why even bother in instances when it’s cheaper and more convenient to simply take on-demand wheels such as Uber and Lyft ).
Conventional wisdom dictates focusing on the renting party…the customer. But the car rental company can’t fully know and engage the traveler and shape his experience without:
- Cognizance of the airline’s immediate connection as mediator of the transaction
- Awareness of the traveler’s peripheral connections. These connections can include, for example, the car renter’s spouse, who may also be a designated driver, the car renter’s employer and the corporate affiliations of the car renter’s employer who has a corporate contract rate for business-related rentals.
- Knowledge of the airline, the car renter, and the car renter’s employer in other business contexts. For example, the airline not only mediates the car rental transaction, they are also a corporate customer and a supplier to the car rental company. After all, airlines rent cars for their employees on business trips and sell their airline services to car rental companies. Similarly, the car renter may be traveling for business or leisure. For each business context the traveler and the airline each have different sets of connections and data relationships.
At first blush, all this information may seem readily at hand. It’s usually not. Enterprise information is rarely modeled in contexts outside the perimeters of a single system and the full extent of connections is highly fragmented.
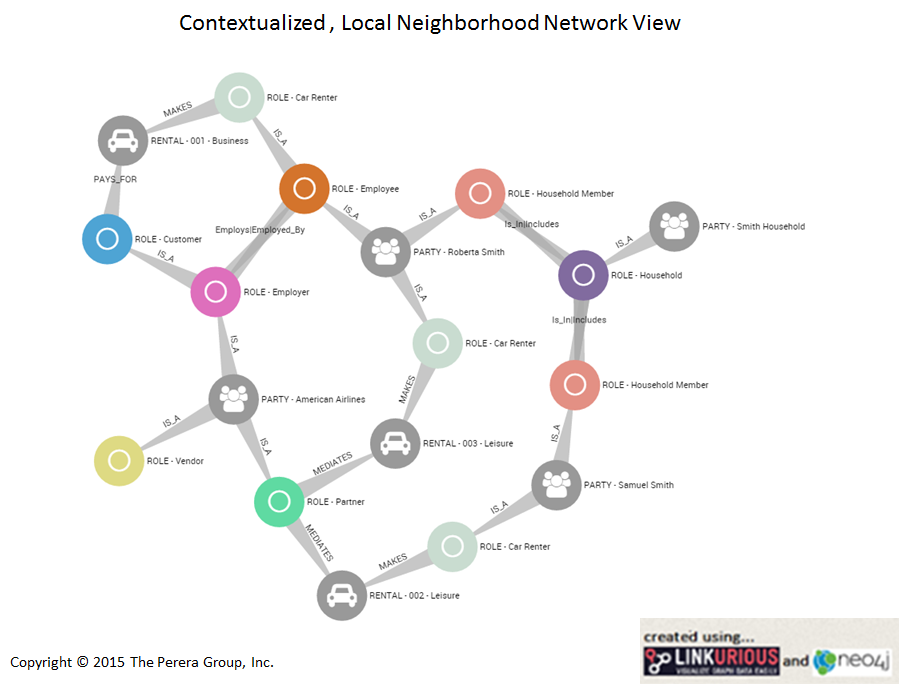
Snap on a context-aware graph database and we obtain insights from connections between constituent parties and capabilities to search for patterns of connections between parties. Here’s what a contextualized, local neighborhood network view of transactions, interactions and connections might look like to the car rental company.
 .
.
We would be hard pressed with current enterprise software to discover the insights that we can glean just from even this simple local neighborhood network view. (For example, Sam Smith who rented a car on American Airlines’ website for leisure travel is married to Roberta Smith. Roberta is an American Airlines employee who rents cars under a corporate rate for business travel. The car rental company has an American Airlines corporate air fare agreement for employee travel.) Now imagine a capability to search, visualize and analyze a full-blown, contextualized connectome with thousands, millions, even billions of interconnections and data relationships.
Network analysis on this scale is outside the purview of traditional CRM and MDM capabilities built solely on relational databases. In the past, businesses may not have needed to know patterns of connections crisscrossing their connectome. Now they do.
Analyzing the vast array of interconnections between parties across contexts could present new opportunities for data discovery, which in turn, impact customer engagement and experience. Such is the latent potential of mapping an organization’s connectome with a graph database.
The enabling master graph, as displayed in the above image of a contextualized, local neighborhood network view, consists of three components:
1. Separate but directly connected party and role nodes.
2. Edges connecting a party and a role node, two connected role nodes corresponding to a single party node, and a role node of one party and the role node of another party.
Contextual identity is a party node and its connection to a role node. And since a party node can be connected to many role nodes, a single party can possess multiple contextual identities.
This is a key concept, because all other data relationships exist as connections to role nodes. Party nodes are only connected to role nodes.
This is a radical departure from conventional enterprise software design, where data relationships such as purchases, opportunities, campaigns and whatnot correspond to the party. In the envisioned contextualized network view, data relationships only correspond to a party in a role.
3. The minimal properties that party and role nodes and their corresponding edges require for parties, i.e. persons, organizations and groups, to have contextual identity.
Conclusion – KISS My Data
In 1955 Joseph Luft and Harry Ingham, two psychologists at UCLA, devised a model for understanding group dynamics.
Using the first few letters in their first names, they dubbed it The Johari Window.
The Johari Window proffers four ways to classify information about members of a group: Observable, Blind, Hidden and Unknown. Here’s Luft’s and Ingham’s model applied to understanding customers.
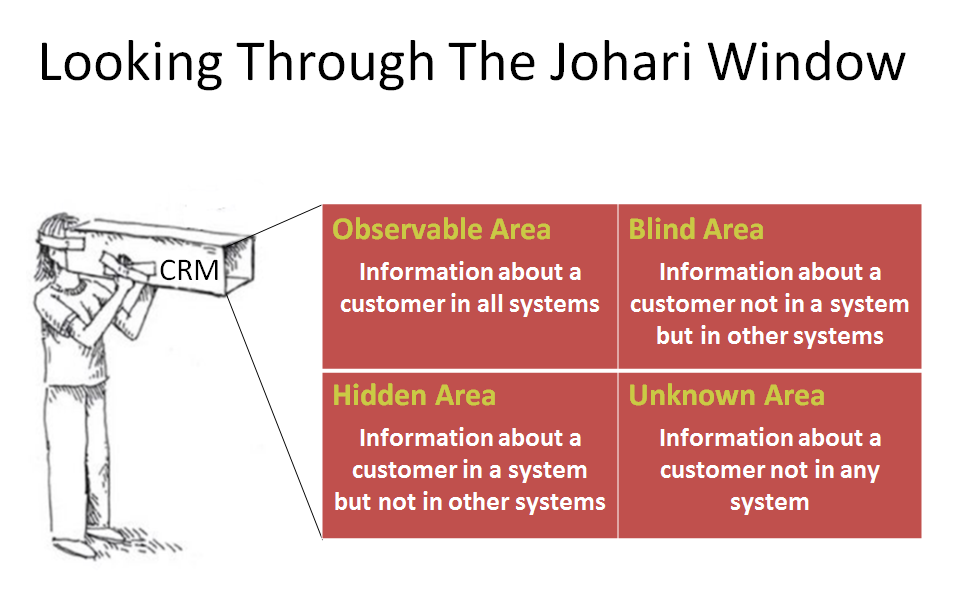
Most of us would instantly agree we should seek to improve our “customer view” in two ways. First, eliminate blind spots and hidden areas through customer data integration. Traditional MDM makes this possible. Second, get our hands on more data about customers from first and third party sources to fill in unknown areas.
But even as MDM and CRM resolve blind spots and hidden areas and external data sources make the unknown known, we still suffer tunnel vision, albeit 20/20 tunnel vision.
The reason is our reference frame. Turns out we are looking through a smaller, if not the wrong window. In CRM vernacular, we are only looking at accounts and contacts and hierarchical displays.
Instead, let’s wonder about observable, blind, hidden and unknown network information, including contextualized data relationships and connections, among all business constituents, not just customers. The implications of a contextualized network view on creating and keeping customers suggest that CRM and MDM are inadequate for modern business operations and analysis.
In a recent TechCrunch post, Ron Miller observes, “Companies like Microsoft and Salesforce are hoping to simplify (how we deal with data).” But is SalesForce’s and Microsoft’s thinking blatant complexity avoidance, if not complexity denial?
We are persistently reminded to KISS – “keep it simple, stupid”. But we are stupid transacting and interacting with customers and managing constituent party data using CRM and MDM data models that focus on constituent parties in one context.
We confuse “complexity” and “complicated”. The only complication is trying to make CRM and customer MDM data models represent necessarily complex, contextualized connections among business constituents using single-minded relational schemas.
CRM and customer MDM have not become white elephants, but more like the elephants in John Saxes’ version of the famous Indian story about six blind men. They are, as the story illustrates, “inherently limited by (their) failure to account for other truths or a totality of truth”.
To constructively stretch the truth, we need graph databases with search, visualization and analytical capabilities that peer into contextualized connections among constituent parties and expose underlying data relationships and patterns. And to do this, we need a master graph. A context-aware master graph.