

 March is my favorite month. The weather starts to warm up (well, at least it used to). We honor St. Patrick’s Day, which happens to double as my anniversary. My eldest daughter was born in March. And in addition to all these personal milestones and celebrations, March plays host to my favorite sporting event—the NCAA Men’s Basketball Tournament, otherwise known as March Madness.
March is my favorite month. The weather starts to warm up (well, at least it used to). We honor St. Patrick’s Day, which happens to double as my anniversary. My eldest daughter was born in March. And in addition to all these personal milestones and celebrations, March plays host to my favorite sporting event—the NCAA Men’s Basketball Tournament, otherwise known as March Madness.
Student athletes playing their hearts out in a survive-and-advance tournament, combined with the David-and-Goliath matchups that produce Cinderella stories every year creates an atmosphere that can’t be beat.
It’s a galvanizing event that brings together friends, families, and coworkers to participate in office pools, where we all use our own strategies for filling out our brackets.
Using Sentiment Analysis of social media, I thought it would be interesting and hopefully entertaining to turn my tools toward the public’s emotions around the brackets.
For the uninitiated, sentiment analytics is one of the ways businesses can derive insights from the vast amounts of textual data they are collecting. Based on the tone (positive or negative) of the text, it receives a numeric score. Once it is quantified, the value can be used for additional analysis. For example, sentiment scores are particularly helpful in prioritizing responses to customer feedback.
We are calling this analysis “Gladness, Sadness and March Madness” because it’s all about finding emotion in the text.
To do this, we calculated sentiment scores for all of the posts and comments on the Facebook page for each of the 68 teams participating in this year’s tournament, for one week leading up to the tournament (March 9-17).
Each team has a certain percentage of posts that scored positively on their page and a certain percentage of posts that scored negatively.
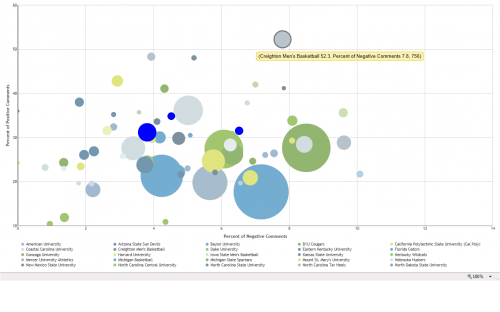
As expected, our sentiment scores created several upsets, which can be seen in the brackets in the images. Here are some highlights:
- In the opening round, No. 16 seed and play-in victor Albany pulled a stunning upset over top seeded Florida – 53.25 percent of the posts on Albany’s page scored to only 25.56 percent on the Gators page
- Many of the pundits have picked Michigan State as a likely winner this year. They survived the first round of March Madness but were eventually defeated by Harvard
- There was a defensive struggle in Round 1 between the Oregon Ducks and BYU, with BYU winning by a score of 25 percent to 13.24 percent
- There were two buzzer beaters in the Elite 8 – Albany continued its Cinderella run by upsetting Stanford 53.25 percent to 52.25 percent and Harvard slipped past University of Wisconsin–Milwaukee 45.75 to 44.59 percent
- The analysis showed a Final Four that no one would expect going on pure basketball knowledge—Albany, Harvard, Kansas St. and Creighton.
- The Creighton Blue Jays took on the Cinderella story from Albany and took home the NCAA title having a 60.05 percent sentiment score to Albany’s 53.25 percent
This exercise highlights a few key pieces of functionality available within a comprehensive business intelligence and analytics platform:
The ability to use social data to do comparative or competitive analysis.
- The ability to quantify textual data by applying sentiment scores to help get more value out of the data. In this example, the sentiment scoring engine was applied to social data, but it can be applied to any textual data such as that found in feedback companies receive from customers, citizens, patients, etc.
I wish everyone interested in the tournament good luck in office pools. I’m in several myself…and I like Michigan State and Virginia as favorites.


