
We use cookies, including third-party cookies from Google to serve personalized ads through AdSense, to operate this site and understand how it is used. By continuing to browse, you accept this use. See our Privacy Policy and Terms of Use for details, including how to opt out of personalized advertising.
Accept
SmartData CollectiveSmartData Collective
  • Analytics
    AnalyticsShow More
    What Kind of Problem-Solving Distinguishes Data Analysts From Software Engineers -- AI-generated illustration
    What Kind of Problem-Solving Distinguishes Data Analysts From Software Engineers
    7 Min Read
    chatgpt image jul 21, 2026, 04 34 30 pm
    4 Core Benefits of Predictive Maintenance after Vibration Analysis
    10 Min Read
    How Does Data Mining Boost Customer Satisfaction in Logistics? Harnessing Analytics for Results -- AI-generated illustration
    How Does Data Mining Boost Customer Satisfaction in Logistics? Harnessing Analytics for Results
    11 Min Read
    chatgpt image jul 13, 2026, 04 23 45 pm
    How Data Analytics Helps Companies Improve User Engagement
    19 Min Read
    chatgpt image jul 13, 2026, 03 59 46 pm
    How Data Analytics Improves Multi-Location Search Strategies
    10 Min Read
  • Big Data
  • BI
  • Exclusive
  • IT
  • Marketing
  • Software
Search
© 2008-25 SmartData Collective. All Rights Reserved.
Reading: Getting a Web application to talk to R
Share
Notification
Font ResizerAa
SmartData CollectiveSmartData Collective
Font ResizerAa
Search
  • About
  • Help
  • Privacy
Follow US
© 2008-23 SmartData Collective. All Rights Reserved.
SmartData Collective > Uncategorized > Getting a Web application to talk to R
Uncategorized

Getting a Web application to talk to R

DavidMSmith
DavidMSmith
2 Min Read
Getting a Web application to talk to R
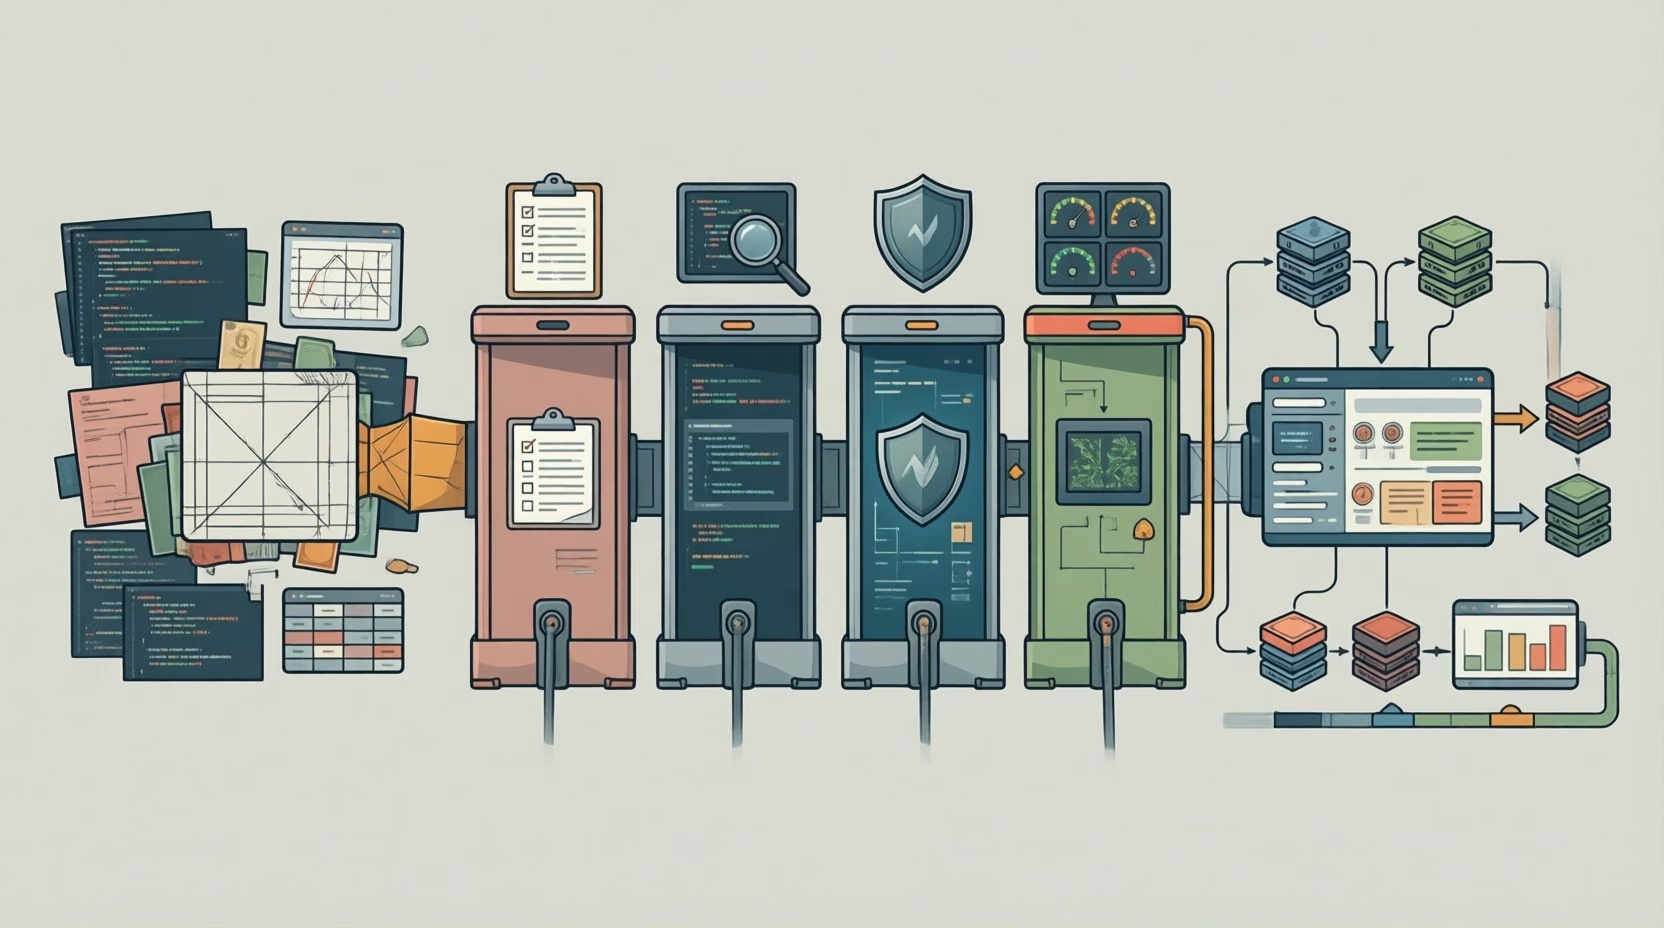
Illustration generated with FLUX.2 [klein 4B] via Cloudflare Workers AI.
SHARE

Let’s face it: you can do some pretty awesome things with R — statistical models, beautiful charts, you name it — but if the only way to do those things is from the R command line you’re limiting the audience of people who might make use of all this awesomeness to a limited subset: R programmers.

What if you could get the results of R programs, charts and data, into a Web application? R’s an open system, so it’s definitely possible. To get started, Neil Saunders shows us how to build a simple Web application that displays data and a chart from an R script, by serving JSON or CSV from Rails to RApache and sending a result back to Rails. As he points out, it’s not a complete solution — “a real application would require more model or controller methods, views, R functions, error checks and prettier views, perhaps with a dash of AJAX thrown in”, but it’s a great starting point.

What You’re Doing Is Rather Desperate: Getting your web application and R(Apache) to talk to each other

Link to original post

More Read

Can Consultants Lead? Three Viewpoints
Twitter, Meaningful Conversations, and #FollowFriday
SWITCH & Lead Change by Design: A Comparison
How to Define Big Data
Order-to-Cash Cycle for Revenue Recognition
TAGGED:integration
Share This Article
Facebook Pinterest LinkedIn
Share

Follow us on Facebook

Latest News

Flat editorial illustration: The article's core relationship is between aggregated workplace data (occupancy, environmental, feed
How Businesses Can Use Workplace Data to Create Better Office Environments
Big Data Business Intelligence Exclusive
Flat editorial illustration: The article's core relationship is the engineering transition from an AI prototype to a production-r
From AI Prototype to Production: Observability and Scalability Requirements for Data-Heavy SaaS Applications
Artificial Intelligence Exclusive
Preparing Data Systems and Governance for a Scaling Global Gaming Brand -- AI-generated illustration
Preparing Data Systems and Governance for a Scaling Global Gaming Brand
Big Data Infographic
How Restaurant POS and Ordering Data Reveal Generational Customer Patterns -- AI-generated illustration
How Restaurant POS and Ordering Data Reveal Generational Customer Patterns
Exclusive Infographic

Stay Connected

1.2KFollowersLike
33.7KFollowersFollow
222FollowersPin

You Might also Like

Enterprise Integration
Cloud ComputingComputingData Management

Why Custom Enterprise Integration Demands Cloud Services

4 Min Read
Scoring data in ADAPA via web services using SQL Server Integration Services (SSIS)
Business IntelligenceData MiningData VisualizationData WarehousingPredictive Analytics

Scoring data in ADAPA via web services using SQL Server Integration Services (SSIS)

9 Min Read
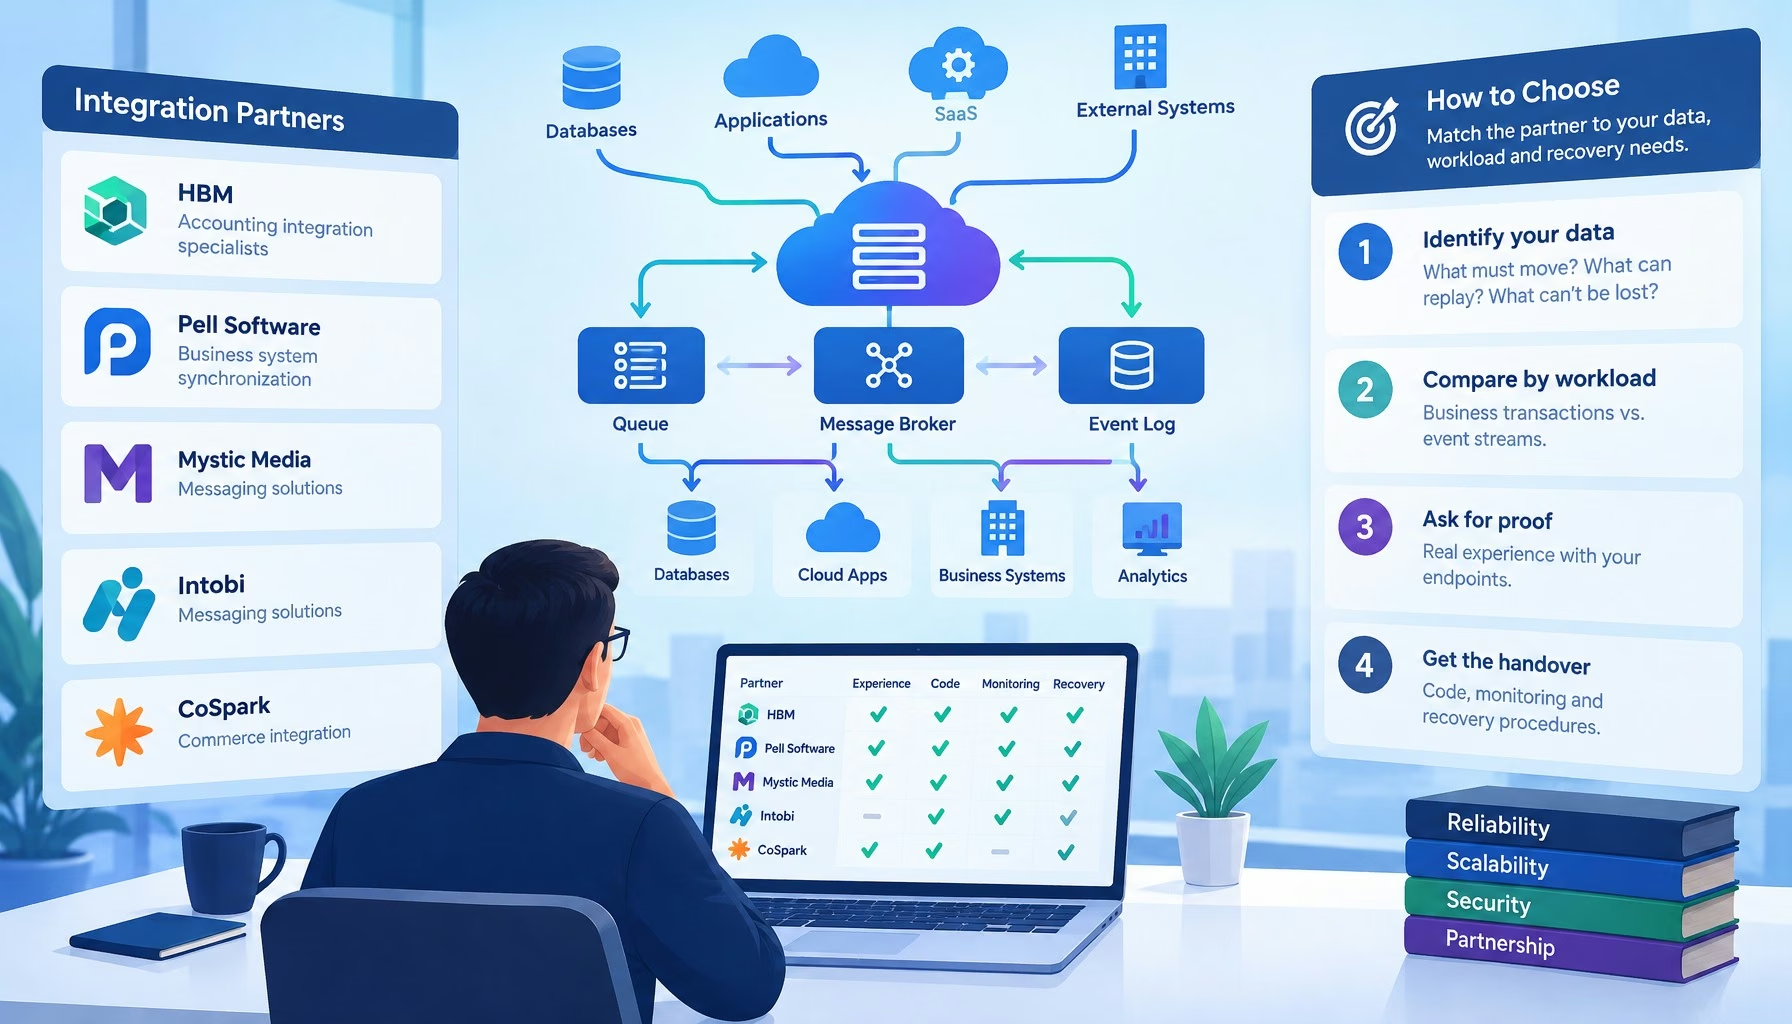
Technical architecture diagram and decision framework for choosing an integration partner for data pipelines: service bus, brokers, and azure-native middleware compared
DevelopmentExclusive

Choosing an Integration Partner for Data Pipelines: Service Bus, Brokers, and Azure-Native Middleware Compared

11 Min Read
Predictive Analytics: 8 Things to Keep in Mind (Part 1)
Business IntelligenceData MiningPredictive Analytics

Predictive Analytics: 8 Things to Keep in Mind (Part 1)

6 Min Read

SmartData Collective is one of the largest & trusted community covering technical content about Big Data, BI, Cloud, Analytics, Artificial Intelligence, IoT & more.

ai chatbot
How AI Website Chatbots Improve Customer Support and Lead Generation
Chatbots Exclusive
Artificial Intelligence for eCommerce: A Closer Look
Artificial Intelligence

Quick Link

  • About
  • Contact
  • Privacy
Follow US
© 2008-26 SmartData Collective. All Rights Reserved.
Welcome Back!

Sign in to your account

Username or Email Address
Password

Lost your password?