We use cookies, including third-party cookies from Google to serve personalized ads through AdSense, to operate this site and understand how it is used. By continuing to browse, you accept this use. See our Privacy Policy and Terms of Use for details, including how to opt out of personalized advertising.
Accept
SmartData CollectiveSmartData Collective
  • Analytics
    AnalyticsShow More
    What Kind of Problem-Solving Distinguishes Data Analysts From Software Engineers -- AI-generated illustration
    What Kind of Problem-Solving Distinguishes Data Analysts From Software Engineers
    7 Min Read
    chatgpt image jul 21, 2026, 04 34 30 pm
    4 Core Benefits of Predictive Maintenance after Vibration Analysis
    10 Min Read
    How Does Data Mining Boost Customer Satisfaction in Logistics? Harnessing Analytics for Results -- AI-generated illustration
    How Does Data Mining Boost Customer Satisfaction in Logistics? Harnessing Analytics for Results
    11 Min Read
    chatgpt image jul 13, 2026, 04 23 45 pm
    How Data Analytics Helps Companies Improve User Engagement
    19 Min Read
    chatgpt image jul 13, 2026, 03 59 46 pm
    How Data Analytics Improves Multi-Location Search Strategies
    10 Min Read
  • Big Data
  • BI
  • Exclusive
  • IT
  • Marketing
  • Software
Search
© 2008-25 SmartData Collective. All Rights Reserved.
Reading: IRS Internal Migration Data and Housing Bubble
Share
Notification
Font ResizerAa
SmartData CollectiveSmartData Collective
Font ResizerAa
Search
  • About
  • Help
  • Privacy
Follow US
© 2008-23 SmartData Collective. All Rights Reserved.
SmartData Collective > Big Data > Data Mining > IRS Internal Migration Data and Housing Bubble
Business IntelligenceData MiningData Visualization

IRS Internal Migration Data and Housing Bubble

Editor SDC
Editor SDC
2 Min Read
IRS Internal Migration Data and Housing Bubble
Photo by charlygutmann on Pixabay (https://pixabay.com/photos/hands-help-migration-2582585/)
SHARE

Earlier this week, I suggested a potential business application of IRS’s internal migration data for a moving and relocation company.

Folks at Neilsen Claritas just found a far more interesting correlation which should have driven a lot of business decisions.  They note:

Today’s presence of underwater mortgages, or homes with negative equity, seem to be correlated to two common regional U.S. population trends: 1) domestic immigration from the Northeastern region to the South and Southwestern regions of the U.S., and 2) migration from coastal California inland

While such retrospective analysis is interesting for reports and blogs, it is not particularly useful for businesses. Maybe as means to generate  interesting hypothesis for future. It would have been useful had the chart been available to the strategic planning or risk group of businesses signing up people for these housing loans in 2006 and 2007.

More Read

Visualizing Data in 3D with Lego
Open Source Analytics Reaches Main Street (and Some Other Trends in Analytics)
4 Best Practices for Sharing Workforce Data: Standardized Dashboards
Moxie Consolidates Software Solutions
How Savvy Marketers Transform “Big Consumer Data” into Customer Wins

Data is valuable only when it is used to drive decisions. Most companies have a huge opportunity to do a better job in bringing together data, analytics and visualization and delivering them to the points of decision.


TAGGED:data miningdata visualization
Share This Article
Facebook Pinterest LinkedIn
Share

Follow us on Facebook

Latest News

Flat editorial illustration: The article’s core relationship is between growing compute density and adaptable rack hardware that
6 Details That Make a Data Centre’s Server Room Easier to Scale
Best Practices Data Management Exclusive IT
Flat editorial illustration: The article’s core relationship is a transfer of discipline from regulated laboratories to analytics
What Business Intelligence Teams Can Learn from Lab Data Governance
Business Intelligence Exclusive
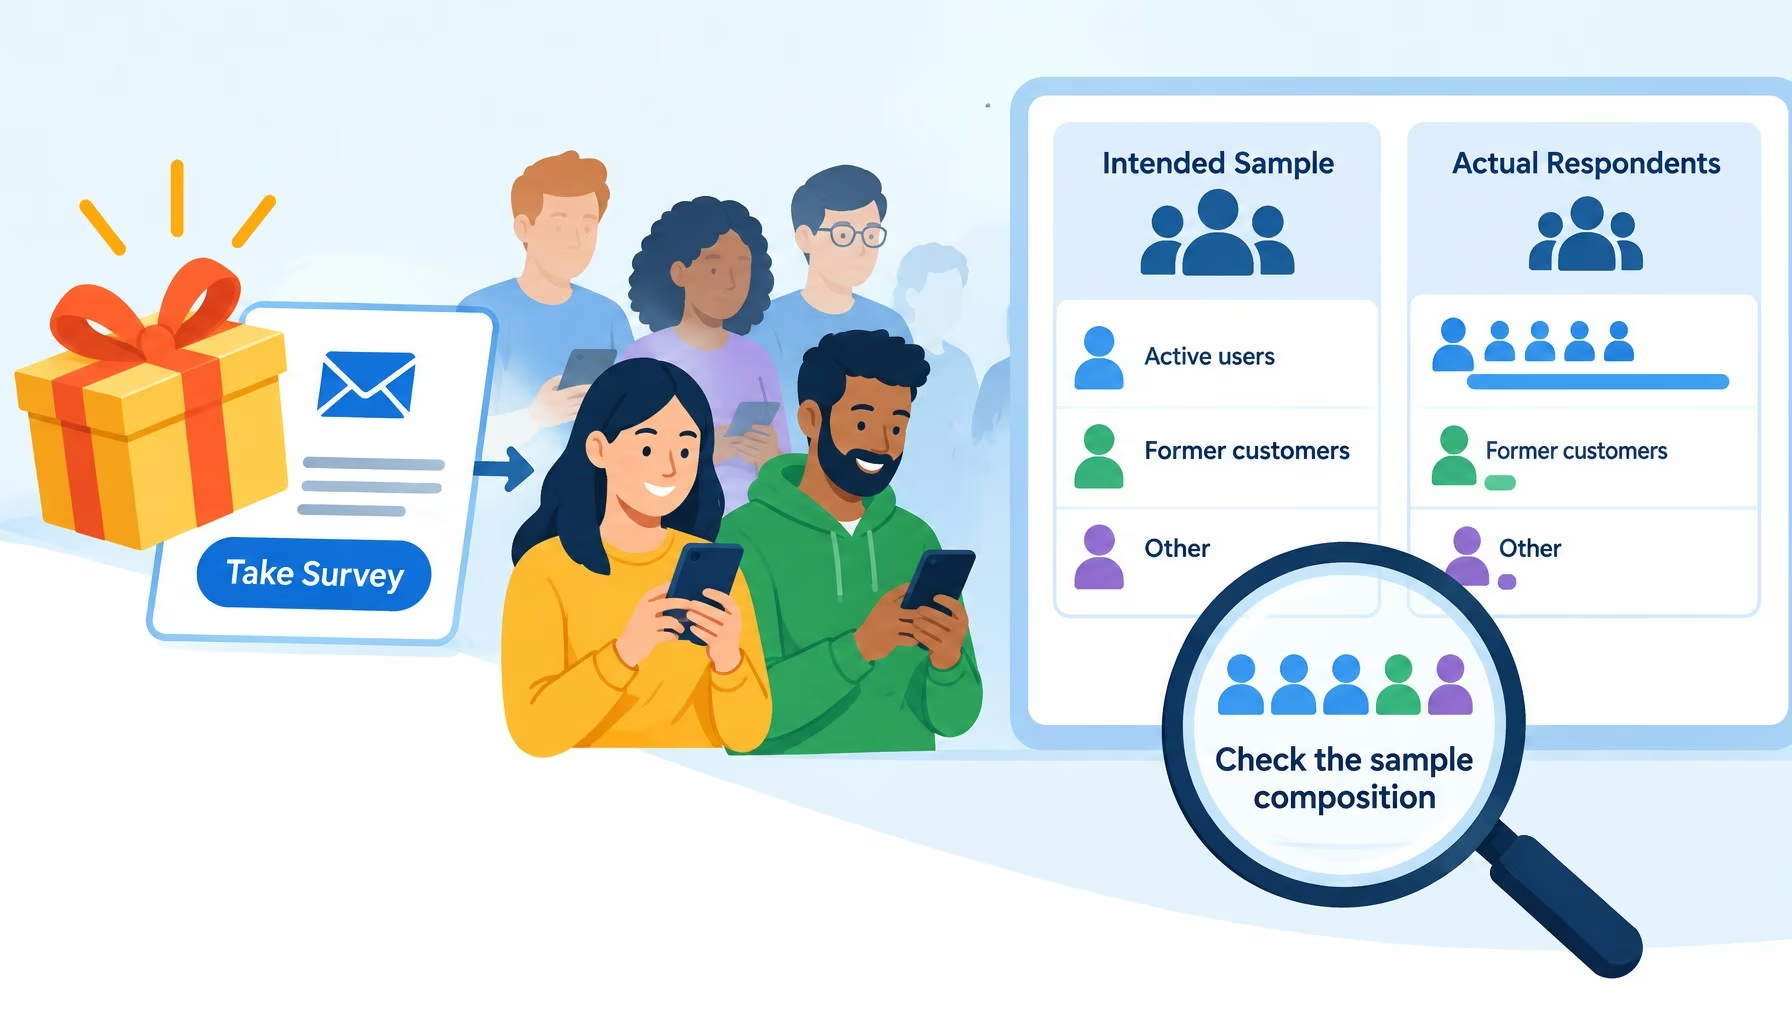
Flat editorial illustration: A guaranteed reward can raise participation while skewing the respondent pool toward active customer
Incentive-Driven Response Bias: Auditing Sample Composition Before You Trust Survey Data
Big Data Data Quality Exclusive
Flat editorial illustration: The article’s core relationship is observable blockchain activity becoming a trustworthy business me
Blockchain Dashboards Need Better Definitions, Not More Charts
Blockchain Exclusive

Stay Connected

1.2KFollowersLike
33.7KFollowersFollow
222FollowersPin

You Might also Like

Data Visualization: Why (1 of 2)
Data Visualization

Data Visualization: Why (1 of 2)

8 Min Read
Business Intelligence: Intuitive vs Cool Data Visualization and Infographics
AnalyticsBusiness IntelligenceCommentaryData Visualization

Business Intelligence: Intuitive vs Cool Data Visualization and Infographics

8 Min Read
SQL Visualization in the Spreadsheet
Big DataBusiness IntelligenceData ManagementData MiningInside CompaniesNew ProductsSoftwareSQLUnstructured Data

SQL Visualization in the Spreadsheet

5 Min Read
Getting the other 90% of analytic adoption to happen
Data MiningExclusivePredictive Analytics

Getting the other 90% of analytic adoption to happen

7 Min Read

SmartData Collective is one of the largest & trusted community covering technical content about Big Data, BI, Cloud, Analytics, Artificial Intelligence, IoT & more.

How To Get An Award Winning Giveaway Bot
Big Data Chatbots Exclusive
Artificial Intelligence for eCommerce: A Closer Look
Artificial Intelligence

Quick Link

  • About
  • Contact
  • Privacy
Follow US
© 2008-26 SmartData Collective. All Rights Reserved.
Welcome Back!

Sign in to your account

Username or Email Address
Password

Lost your password?