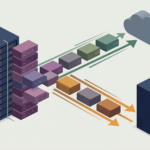
Most enterprise analytics initiatives stall for a mundane reason: dashboards deliver answers to questions asked three weeks ago, while operational teams need decisions on anomalies occurring this morning. For over fifteen years, data organizations treated visualization platforms as the definitive endpoint of business intelligence. You extracted raw transactional rows, scheduled overnight pipeline transformations, and published interactive charts in Tableau or Power BI. If an executive wanted to understand why gross margins slipped in the Southwest territory, they submitted an IT ticket and waited.
- Comparing Modern Analytics Paradigms: An Executive Decision Matrix
- The Collapse of the Dashboard Graveyard
- Re-Architecting the Ingestion Tier: Autonomous ETL and Synthetic Data
- Compound AI Systems: Why Monolithic Text-to-SQL Fails in Production
- The Semantic Layer as the Non-Negotiable Context Engine
- Real-World Failure Modes and the ‘Cartesian Cliff’: An Engineering Guide
- Multivariate Anomaly Detection and Causal Attribution
- Enterprise Case Studies: How Modern Fleets Actually Deploy AI Analytics
- Case Study A: Global Logistics Fleet Replaces Freight Margin Dashboards
- Case Study B: FinTech Payment Provider Isolates High-Frequency Checkout Degradation
- Case Study C: Enterprise SaaS Platform Unifies Customer Health Scoring
- The Evolution of the Analytics Engineer: From Ticket Triage to Semantic Architect
- The 2026 Enterprise Implementation Roadmap
That visual reporting paradigm is collapsing under its own operational weight. The core challenge facing modern enterprises is no longer a lack of charts; it is decision latency. Connecting generative models and reasoning agents directly across storage engines and semantic catalogs inverts the traditional workflow. Instead of forcing human analysts to hand-craft static views for hypothetical questions, modern architecture deploys autonomous compound systems that evaluate multivariate anomalies, synthesize root causes, and trigger operational workflows in seconds.
Yet beneath the commercial marketing promises of effortless conversational querying lies a rigorous engineering reality. Artificial intelligence does not eliminate data discipline. In practice, it punishes sloppy schema design and fragmented definitions faster than any human user ever could. SmartDataCollective has tracked enterprise information systems and database strategy since 2008. What follows is an unvarnished technical assessment of how AI is structurally re-architecting data analytics in production estates, where the true architectural boundaries sit, and why the semantic layer—not the underlying model—determines whether your deployment succeeds.
Comparing Modern Analytics Paradigms: An Executive Decision Matrix
Enterprise data platforms generally fall into three distinct architectural categories. Evaluating the performance, latency, schema fragility, and governance trade-offs between them clarifies where engineering capital belongs:
| Architecture Layer | Primary Strengths | Core Operational Bottleneck | Governance & FinOps Profile | Ideal Production Use Case |
|---|---|---|---|---|
| Traditional Dimensional BI (Star Schemas, Tableau, Power BI) | Deterministic outputs, fixed computational spend, established compliance and auditability. | High analyst ticket latency; rigid schemas cannot accommodate rapid exploratory questions. | Low risk. Access strictly governed through role-based database views and pre-aggregated tables. | Regulatory financial reporting, board presentations, standardized monthly close metrics. |
| AI-Augmented Semantic Layer (Cube, dbt MetricFlow, ThoughtSpot) | Sub-second natural language translation, unified business metric definitions, zero raw SQL for end-users. | Requires disciplined upstream schema modeling and ongoing metric catalog governance. | Moderate risk. Demands query sandboxing, row-level credential pass-through, and cache warming. | Self-serve departmental analytics, ad-hoc exploratory investigations, operational KPI monitoring. |
| Autonomous Compound Data Agents (Multi-Agent Graph Workflows, Databricks Genie) | Executes multi-step data pipelines, identifies cross-table anomalies, suggests remediation actions automatically. | Non-deterministic cost structures; token and query usage spikes during unconstrained graph traversals. | High risk. Demands hard execution timeouts, budget governors, and write-permission blocks. | Real-time fraud triage, automated logistics rerouting, continuous revenue leak audits. |
The Collapse of the Dashboard Graveyard
The central promise of modern business intelligence was self-serve exploration. If data engineering built enough pipelines and loaded enough data into cloud warehouses, business operators would explore their own domains and make evidence-based decisions. That hypothesis was thoroughly tested over the last decade, and the results are sobering. Industry telemetry indicates that upwards of seventy percent of enterprise dashboards are accessed fewer than four times after their initial release. Organizations have inadvertently funded massive visual graveyards—hundreds of bespoke dashboards that require continuous maintenance but deliver minimal operational impact.
The failure of the traditional dashboard is rooted in cognitive architecture. Dashboards represent a passive ‘pull’ mechanism. They present aggregated metrics—a revenue curve, an average order value, a churn percentage—and leave the cognitive burden of diagnostic synthesis entirely to the user. When an executive sees that net revenue fell three percent last week, the dashboard cannot explain why. Finding the root cause requires the user to manually slice across dozens of dimension filters, guess which segments caused the divergence, or revert to filing a ticket with the data team.

Artificial intelligence inverts this dynamic from reactive human pull to proactive agentic push. Rather than waiting for a business user to log into an analytics portal, scan a grid of charts, and notice an anomaly, modern analytical engines continuously evaluate underlying event streams. When an unexpected divergence occurs, the system decomposes the variance across all available dimensional attributes, isolates the root cause, and delivers a synthesized narrative directly into the workflow of the responsible team. The interface shifts from a passive visual canvas to an active diagnostic partner.
Re-Architecting the Ingestion Tier: Autonomous ETL and Synthetic Data
Before analytics reaches an executive query bar or reasoning agent, data must be extracted, normalized, and validated across disparate source systems. Historically, data ingestion was the most labor-intensive bottleneck in enterprise IT. Engineering teams spent thousands of hours writing brittle custom connectors, debugging timestamp parsing discrepancies, and maintaining regex scripts to extract structured fields from semi-structured JSON payloads.
Modern AI reshapes this foundational layer through automated schema inference and adaptive transformation. Modern ingestion engines parse incoming payload drift in real time, automatically mapping newly added application attributes into appropriate data warehouse staging tables without crashing downstream pipeline runs. When third-party API providers modify their response contracts without prior notice, intelligent parsers identify the structural alteration, preserve payload fidelity, and generate suggested transformation patches for engineering review.
Concurrently, the emergence of high-fidelity synthetic data has fundamentally transformed how analytics teams build and stress-test data models. In privacy-regulated sectors such as healthcare and financial services, strict compliance frameworks like GDPR and HIPAA severely restrict developer access to production transactional records. Rather than developing analytical models against distorted, masked data or risking compliance violations, organizations increasingly leverage generative models to produce statistically identical synthetic datasets. These artificial distributions preserve complex multi-table relationships and edge-case variances while completely eliminating personal identifiable information (PII).
Synthetic data is equally pivotal for evaluating machine learning pipelines against rare operational stress events. In predictive maintenance or fraud detection, catastrophic system failures and sophisticated fraudulent transactions represent less than one-tenth of one percent of natural historical records. By programmatically generating thousands of synthetic edge-case scenarios, data science teams train and validate diagnostic algorithms against extreme operational conditions before deploying them into live revenue workflows.
Compound AI Systems: Why Monolithic Text-to-SQL Fails in Production
Early industry demonstrations of generative AI in data analytics presented a seductively simple architecture: take a user’s natural language question, pass it to a large language model alongside a database schema, generate a SQL query, execute it against Snowflake or BigQuery, and display the result. In controlled benchmark evaluations against simple ten-row demo tables, this single-shot approach appears functional. In enterprise production environments featuring hundreds of denormalized relational tables, it fails catastrophically.
The fundamental flaw of single-prompt text-to-SQL is context saturation. An enterprise data estate cannot be compressed into an LLM context window without losing the subtle relationships, data lineages, and operational conventions that govern production databases. When presented with ambiguous table names, a raw model inevitably fabricates plausible but incorrect join conditions, confuses synonym fields, and generates syntactically valid queries that compute erroneous financial metrics.
Production-grade architectures solve this by transitioning from monolithic prompts to Compound AI Systems. Pioneered by researchers at Berkeley AI Research and leading data infrastructure teams, compound systems decouple the analytics task into five specialized, interconnected stages:
- The Intent & Context Planner: Analyzes the natural language inquiry, resolves user identity and role-based access permissions, and determines whether the request requires deterministic aggregation, exploratory modeling, or time-series forecasting.
- The Schema Pruner: Utilizes vector similarity and table metadata graphs to filter an enterprise estate of hundreds of tables down to the precise three or four entities required for the calculation, eliminating context pollution.
- The Semantic Compiler: Translates the pruned intent not into raw database tables, but into governed metric declarations defined inside a centralized semantic catalog.
- The Query Linter & Cost Governor: Intercepts the generated SQL before execution. This critical gate inspects query complexity, checks for missing index filters or unbounded Cartesian joins, and enforces execution budgets.
- The Statistical Reasoner: Evaluates the returned dataset against historical distributions to detect anomalies, hallucinated outliers, or pipeline drift before presenting the findings to the user.
A vital feature of this compound architecture is self-healing execution loops. If a generated query fails at the database execution layer due to an ambiguous column reference or missing group-by clause, the query error traceback is not returned to the user. Instead, an internal reflection agent catches the database compiler error, analyzes the constraint violation, re-reads the schema metadata, and generates a corrected query in milliseconds. By enforcing this multi-stage separation of concerns, enterprise engineering teams achieve query accuracy rates above ninety-five percent, transforming conversational querying from an unreliable gimmick into an audit-ready operational tool.
The Semantic Layer as the Non-Negotiable Context Engine
In modern enterprise analytics, the large language model is effectively a reasoning utility. It possesses broad linguistic comprehension and syntactic fluency, but zero institutional memory. The true defensible moat of an organization’s analytics architecture is its semantic layer—the centralized, code-defined repository of business logic, metric formulas, and access controls.
Consider the mundane reality of how enterprise metrics are calculated. If the sales organization defines ‘Monthly Recurring Revenue’ (MRR) based on booked contracts, while finance defines MRR strictly after wire transfers clear Stripe and merchant processor fees are deducted, no language model can resolve that discrepancy on its own. If you point an AI agent directly at raw relational schemas, it will select whichever field name aligns closest with the user’s prompt tokens. The model does not resolve the institutional ambiguity; it rapidly surfaces conflicting metrics to senior executives, undermining credibility.
Addressing why enterprise architecture must consolidate fragmented platforms into a unified operating environment, Daniel Avancini underscored the operational imperative facing modern data teams:
Companies no longer want to move data between silos or juggle incompatible systems. What they need is a central operating environment that reduces friction, simplifies security and accelerates AI development.
— Daniel Avancini, Chief Data Officer and Co-founder at Indicium, in CIO, January 2026
Implementing an intermediate semantic platform—such as Cube, dbt MetricFlow, or Apache Superset catalogs—establishes a single source of truth. The AI model translates human language into a standardized metric request, and the semantic engine compiles the mathematically verified SQL query. This decoupling prevents models from guessing join paths or metric calculations.
Before connecting conversational agents to internal data warehouses, organizations should thoroughly inspect their infrastructure for signs your technology is outdated, including unmaintained staging tables, manual ETL transformation scripts, and fragmented metric definitions scattered across separate departmental spreadsheets.
Real-World Failure Modes and the ‘Cartesian Cliff’: An Engineering Guide
Deploying AI models across enterprise analytical estates introduces operational failure modes that do not exist in conventional business intelligence. Understanding these risks enables engineering teams to build resilient guardrails before granting broad access:
| Failure Mode | Underlying Architectural Flaw | Production Consequence | Hardened Engineering Mitigation |
|---|---|---|---|
| The ‘Cartesian Cliff’ | Unconstrained conversational agents generating multi-table joins across unpartitioned historical logs. | Sudden exponential spikes in cloud warehouse computing credits (Snowflake, BigQuery, Databricks). | Deploy pre-execution query cost estimators, partition requirement locks, and hard budget timeouts. |
| Silent Metric Divergence | Synonym ambiguity across departmental jargon (e.g., “Active User” vs. “Engaged Account”). | Autonomous agents present conflicting KPI calculations to leadership, eroding analytical trust. | Enforce declarative YAML semantic definitions with strict upstream version control. |
| Schema Drift Hallucination | Unannounced column deprecations or table migrations in upstream application databases. | Agents generate syntactically valid queries that latch onto stale, unmaintained archive tables. | Implement automated schema testing in CI/CD pipelines that update the model context window on push. |
| PII & Credential Exposure | Passing raw database error messages or sensitive table contents through external inference APIs. | Proprietary corporate financial data or customer PII exposed in external vendor logging tiers. | Run localized token sanitization filters and deploy private inference endpoints within enterprise VPCs. |
The financial risk of conversational analytics is particularly acute. In conventional reporting, query load is predictable: dashboards execute pre-compiled SQL queries with established aggregation tiers. When business users are granted unrestricted conversational access, a single ambiguous inquiry—such as “Compare lifetime customer engagement across all product interactions since 2021”—can inadvertently trigger a full-table scan across billions of unindexed log rows. Without strict query plan interceptors, organizations risk burning thousands of dollars in warehouse compute before an engineer can intervene.
To eliminate this ‘Cartesian Cliff’, enterprise FinOps teams implement three mandatory architectural controls: First, establish virtual warehouse query quotas that terminate any single exploratory transaction exceeding pre-set credit limits. Second, enforce query rewrites that mandate partition pruning on date ranges and tenant IDs. Third, route all conversational discovery queries to dedicated, isolated read replicas or materialized semantic aggregates, ensuring that ad-hoc exploratory searches can never degrade core production reporting pipelines.
Multivariate Anomaly Detection and Causal Attribution
For decades, enterprise data monitoring relied on static threshold rules. An engineering team configured an alert: if daily failed transactions exceeded five percent, trigger a PagerDuty or Slack notification. In production, static thresholds fail in two opposite directions. During planned maintenance windows or promotional surges like Black Friday, they inundate on-call teams with false positives, causing alert fatigue. Conversely, subtle and damaging micro-anomalies that remain within nominal boundaries slip past entirely unnoticed.
Machine learning models evaluate multivariate time-series data holistically. Rather than monitoring a single metric in isolation, an intelligent anomaly engine analyzes transaction volume, payment gateway latency, browser user-agent distributions, and geographic telemetry simultaneously. As detailed in our analysis of ways that AI improves business analytics insights, the breakthrough is automated dimensional variance decomposition.
Highlighting why data consistency and end-to-end connectivity across operational systems are essential for modern analytics, John Clemons emphasized the practical necessity of integrated data foundations:
It connects siloed process and product data, linking requirements to execution and aligning expected outcomes with actual results.
— John Clemons, Solution Consultant at Rockwell Automation, in Forbes, April 2026
When overall revenue dips unexpectedly, the system does not simply send an alert stating that sales dropped. An agentic diagnostic engine isolates the anomaly across constituent dimensions within seconds. It identifies that eighty percent of the revenue loss originated specifically from mobile Safari checkouts in the UK following an API timeout with a regional merchant processor. What historically required four hours of diagnostic querying by a senior analytics engineer is delivered to the engineering desk in forty seconds.
Enterprise Case Studies: How Modern Fleets Actually Deploy AI Analytics
Examining production deployments reveals how market-leading enterprises structure their AI analytics investments to achieve measurable business outcomes:
Case Study A: Global Logistics Fleet Replaces Freight Margin Dashboards
A multi-national logistics and freight forwarding enterprise historically managed container profitability using weekly Tableau reports. Regional dispatchers reviewed shipment margins after shipments arrived at destination ports. Due to fluctuating maritime fuel surcharges, localized customs detention fees, and carrier demurrage penalties, thirty-five percent of cross-border shipments experienced margin erosion that was only detected weeks after delivery.
The organization replaced their weekly reporting cycle with an agentic monitoring system connected to Snowflake and their enterprise transport management system. Autonomous agents track live container movement events against contractual cost milestones. When demurrage accrual rates exceed historical benchmarks at Rotterdam or Long Beach, the agent identifies the root cause—such as delayed customs paperwork submission—and automatically routes an action prompt to the local operations desk. By shifting from retrospective dashboards to proactive exception handling, the firm recovered over four million dollars in annual operating margin.
Case Study B: FinTech Payment Provider Isolates High-Frequency Checkout Degradation
A high-volume merchant payment processing platform was struggling with subtle conversion drops that evaded standard operational threshold monitors. Because aggregate checkout conversion hovered consistently between ninety-seven and ninety-eight percent, rule-based alerts remained quiet even when specific merchant segments experienced significant payment processing failures.
By implementing multivariate time-series anomaly detection, the engineering team automated metric decomposition. Exploring how big data analytics and AI combine to boost performance illustrates how real-time dimensional clustering catches micro-trends. The platform isolated a recurring checkout failure affecting a niche combination of older Android OS devices, localized banking protocols, and 3D Secure verification flows. Correcting the integration reduced merchant customer churn by twenty-two percent within sixty days.
Case Study C: Enterprise SaaS Platform Unifies Customer Health Scoring
A B2B enterprise software provider with over five thousand corporate customers maintained separate analytics silos across Salesforce, Zendesk, and product telemetry databases in BigQuery. Account managers relied on an outdated composite health score updated once per month. Consequently, customer success teams consistently failed to detect account churn risks until renewal conversations were already compromised.
The company deployed a compound analytical agent architecture. By integrating natural language processing over customer support tickets with product telemetry consumption graphs, the system tracks real-time engagement anomalies. When enterprise accounts display leading indicators of churn—such as an abrupt drop in administrator API token calls accompanied by ticket complaints regarding export performance—the platform alerts the dedicated account team within hours, complete with synthesized root-cause documentation and suggested retention mitigations.
The Evolution of the Analytics Engineer: From Ticket Triage to Semantic Architect
The rapid rise of automated querying and natural language synthesis has prompted premature predictions regarding the obsolescence of data professionals. In enterprise reality, artificial intelligence does not eliminate data teams; it fundamentally elevates their architectural responsibility. For the past decade, analytics engineers spent upwards of sixty percent of their working hours fielding low-leverage requests: building minor dashboard variations, modifying column groupings, and manually debugging SQL joins for non-technical stakeholders.
As conversational interfaces absorb routine descriptive inquiries, the center of gravity in data engineering shifts from visual report building to Semantic Protocol Architecture. Forward-thinking analytics practitioners are dedicating their engineering bandwidth to three high-leverage domains:
- Declarative Data Contracts: Authoring and maintaining the canonical business definitions, metric constraints, and mathematical relationships that reasoning agents are strictly required to obey.
- Security Sandboxing & FinOps Governance: Architecting isolated database read replicas, automated query execution limits, and sensitive data sanitization filters to ensure external models cannot degrade production infrastructure.
- Model Evaluation & Drift Auditing: Reviewing execution logs, auditing ambiguous column interpretations, and continuously refining metadata catalogs to systematically improve query accuracy over time.
Organizations that retain their technical staff to build robust data contracts—rather than treating AI as an excuse to downsize engineering headcount—build lasting competitive leverage. The model provides speed; human engineers provide ground truth.
The 2026 Enterprise Implementation Roadmap
Transitioning an enterprise analytics estate from legacy static reporting to an intelligent, agent-ready architecture requires a disciplined, four-stage implementation sequence:
Phase 1: Catalog Triage and Schema Hygiene (Weeks 1–4)
Audit your existing data warehouse schemas. Decommission orphaned staging tables, remove redundant column definitions, and resolve conflicting departmental terminology for critical KPIs before connecting any reasoning model. Establishing a clean dictionary of table metadata is an absolute prerequisite for automated querying.
Phase 2: Semantic Layer Implementation (Weeks 5–8)
Deploy a centralized semantic modeling platform. Codify business metrics into declarative code repositories (YAML) that enforce canonical formulas, primary keys, and join logic. Ensure that all analytical tools—both traditional BI platforms and conversational interfaces—query through this unified metric gateway.
Phase 3: Sandboxing and FinOps Guardrails (Weeks 9–12)
Establish strict compute governance. Route conversational AI query workloads to isolated, read-only database replicas. Enforce pre-execution query cost estimators, hard execution timeouts, and daily compute credit quotas to protect enterprise warehouses from unexpected Cartesian joins.
Phase 4: Closed-Loop Agentic Automation (Weeks 13+)
Expand from conversational query answers to automated operational workflows. Equip validated diagnostic agents with structured API triggers that notify operational teams, generate Jira tickets, or alert supply chain dispatchers when multi-dimensional anomalies are detected.
The Bottom Line: Where Enterprise Advantage Actually Lies
Artificial intelligence does not fix broken data architecture; it accelerates the impact of whatever foundation you already have in place. Organizations that attempt to deploy conversational models over ungoverned, siloed databases will simply generate misleading metrics and excessive cloud bills at unprecedented speed.
The true enterprise winners in the next era of data analytics are not the organizations buying the shiniest conversational add-on or largest foundation model. They are the enterprises that complete the disciplined engineering homework first: standardizing metric definitions inside a hardened semantic layer, enforcing strict FinOps guardrails across cloud compute, and empowering their analytics engineers to operate as system architects. Build the governed semantic foundation first, and the transformative power of AI analytics will naturally follow.