We use cookies, including third-party cookies from Google to serve personalized ads through AdSense, to operate this site and understand how it is used. By continuing to browse, you accept this use. See our Privacy Policy and Terms of Use for details, including how to opt out of personalized advertising.
Accept
SmartData CollectiveSmartData Collective
  • Analytics
    AnalyticsShow More
    chatgpt image jul 21, 2026, 04 34 30 pm
    4 Core Benefits of Predictive Maintenance after Vibration Analysis
    10 Min Read
    How Does Data Mining Boost Customer Satisfaction in Logistics? Harnessing Analytics for Results -- AI-generated illustration
    How Does Data Mining Boost Customer Satisfaction in Logistics? Harnessing Analytics for Results
    11 Min Read
    chatgpt image jul 13, 2026, 04 23 45 pm
    How Data Analytics Helps Companies Improve User Engagement
    19 Min Read
    chatgpt image jul 13, 2026, 03 59 46 pm
    How Data Analytics Improves Multi-Location Search Strategies
    10 Min Read
    cybersecurity efforts
    How Behavioral Analytics and AI Are Redefining Cybersecurity for Boca Raton Businesses
    14 Min Read
  • Big Data
  • BI
  • Exclusive
  • IT
  • Marketing
  • Software
Search
© 2008-25 SmartData Collective. All Rights Reserved.
Reading: Prinicpal Components for Modeling
Share
Notification
Font ResizerAa
SmartData CollectiveSmartData Collective
Font ResizerAa
Search
  • About
  • Help
  • Privacy
Follow US
© 2008-23 SmartData Collective. All Rights Reserved.
SmartData Collective > Analytics > Predictive Analytics > Prinicpal Components for Modeling
Predictive Analytics

Prinicpal Components for Modeling

Editor SDC
Editor SDC
6 Min Read
Prinicpal Components for Modeling
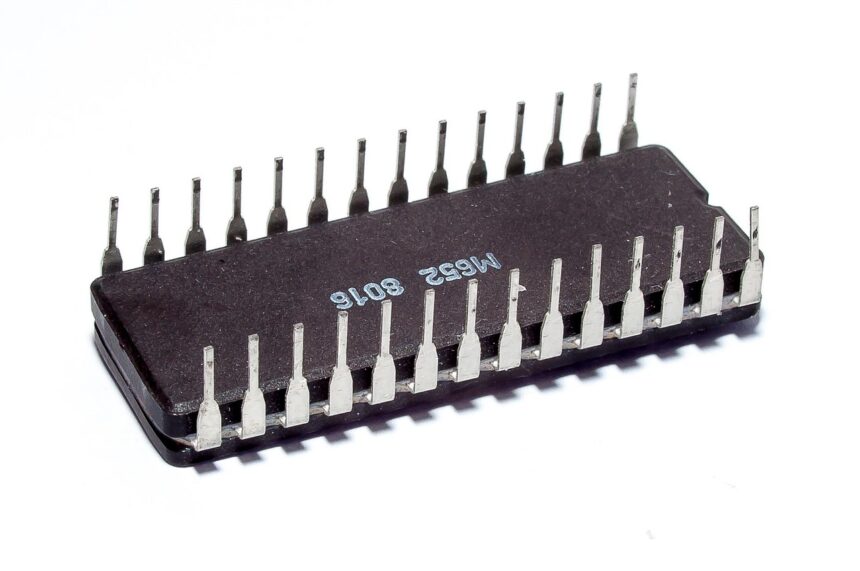
Photo by Silberfuchs on Pixabay (https://pixabay.com/photos/chip-data-processing-pc-computer-298664/)
SHARE

Problem Statement

Analysts constructing predictive models frequently encounter the need to reduce the size of the available data, both in terms of variables and observations. One reason is that data sets are now available which are far too large to be modeled directly in their entirety using contemporary hardware and software. Another reason is that some data elements (variables) have an associated cost. For instance, medical tests bring an economic and sometimes human cost, so it would be ideal to minimize their use if possible. Another problem is overfitting: Many modeling algorithms will eagerly consume however much data they are fed, but increasing the size of this data will eventually produce models of increased complexity without a corresponding increase in quality. Model deployment and maintenance, too, may be encumbered by extra model inputs, in terms of both execution time and required data preparation and storage.

Naturally, the goal in data reduction is to decrease the size of needed data, while maintaining (as much as is possible) model performance, this process must be performed carefully.

A Solution: Principal Components

More Read

Missed It By That Much
Three Ways Big Data Is Revamping Manufacturing Processes
How Business Analytics Can Lead to That ‘Aha’ Moment
Leadership Lessons in Data Quality – Part 1
The Journey from Big Data to Big Promise

Selection of candidate predictor variables to retain (or to eliminate) is the most obvious way to reduce the size of the data. If model performance is not to suffer, though, then some effective measure of each variable’s usefulness in the final model must be employed- which is complicated by the correlations among predictors. Several important procedures have been developed along these lines, such as forward selection, backward selection and stepwise selection.

Another possibility is principal components analysis (“PCA” to his friends), which is a procedure from multivariate statistics which yields a new set of variables (the same number as before), called the principal components. Conveniently, all of the principal components are simply linear functions of the original variables. As a side benefit, all of the principal components are completely uncorrelated. The technical details will not be presented here (see the reference, below), but suffice it to say that if 100 variables enter PCA, then 100 new variables (called the principal components come out. You are now wondering, perhaps, where the “data reduction” is? Simple: PCA constructs the new variables so that the first principal component exhibits the largest variance, the second principal component exhibits the second largest variance, and so on.

How well this works in practice depends completely on the data. In some cases, though, a large fraction of the total variance in the data can be compressed into a very small number of principal components. The data reduction comes when the analyst decides to retain only the first n principal components.

Note that PCA does not eliminate the need for the original variables: they are all still used in the calculation of the principal components, no matter how few of the principal components are retained. Also, statistical variance (which is what is concentrated by PCA) may not correspond perfectly to “predictive information”, although it is often a reasonable approximation.

Last Words

Many statistical and data mining software packages will perform PCA, and it is not difficult to write one’s own code. If you haven’t tried this technique before, I recommend it: It is truly impressive to see PCA squeeze 90% of the variance in a large data set into a handful of variables.

Note: Related terms from the engineering world: eigenanalysis, eigenvector and eigenfunction.

Reference

For the down-and-dirty technical details of PCA (with enough information to allow you to program PCA), see:

Multivariate Statistical Methods: A Primer, by Manly (ISBN: 0-412-28620-3)

Note: The first edition is adequate for coding PCA, and is at present much cheaper than the second or third editions.

TAGGED:data qualitydata reductionpredictive modeling
Share This Article
Facebook Pinterest LinkedIn
Share

Follow us on Facebook

Latest News

Illustration of mobile analytics dashboards with ad performance charts connected to backend databases
11 Best Sisense Alternatives for Embedded Analytics
Business Intelligence Exclusive
Analyst points at colorful circular data dashboard on screen - information technology business metrics
How Fragmented Workplace Tech Undermines Reliable Business Metrics and Reporting
Cloud Computing Exclusive Infographic IT
Using Multi-Source Data and Analytics to Detect Operational Drift Across Franchise Networks -- AI-generated illustration
Using Multi-Source Data and Analytics to Detect Operational Drift Across Franchise Networks
Exclusive Infographic
Beyond The First Impression: The Long-Lasting Impact Of Sensory Marketing -- AI-generated illustration
Beyond The First Impression: The Long-Lasting Impact Of Sensory Marketing
Infographic Marketing

Stay Connected

1.2KFollowersLike
33.7KFollowersFollow
222FollowersPin

You Might also Like

#27: Here's a thought...
Data MiningData Warehousing

#27: Here’s a thought…

9 Min Read
Data Quality: A Cause and Effect Story
Business IntelligencePredictive Analytics

Data Quality: A Cause and Effect Story

4 Min Read
Startups Use Data and Agile for Portfolio Management
Big DataExclusive

Startups Use Data and Agile for Portfolio Management

5 Min Read
Finance Analytics Requires Data Quality
Uncategorized

Finance Analytics Requires Data Quality

9 Min Read

SmartData Collective is one of the largest & trusted community covering technical content about Big Data, BI, Cloud, Analytics, Artificial Intelligence, IoT & more.

The Art of Conversation: Enhancing Chatbots with Advanced AI Prompts
Chatbots
Artificial Intelligence for eCommerce: A Closer Look
Artificial Intelligence

Quick Link

  • About
  • Contact
  • Privacy
Follow US
© 2008-26 SmartData Collective. All Rights Reserved.
Welcome Back!

Sign in to your account

Username or Email Address
Password

Lost your password?