We use cookies, including third-party cookies from Google to serve personalized ads through AdSense, to operate this site and understand how it is used. By continuing to browse, you accept this use. See our Privacy Policy and Terms of Use for details, including how to opt out of personalized advertising.
Accept
SmartData CollectiveSmartData Collective
  • Analytics
    AnalyticsShow More
    What Kind of Problem-Solving Distinguishes Data Analysts From Software Engineers -- AI-generated illustration
    What Kind of Problem-Solving Distinguishes Data Analysts From Software Engineers
    7 Min Read
    chatgpt image jul 21, 2026, 04 34 30 pm
    4 Core Benefits of Predictive Maintenance after Vibration Analysis
    10 Min Read
    How Does Data Mining Boost Customer Satisfaction in Logistics? Harnessing Analytics for Results -- AI-generated illustration
    How Does Data Mining Boost Customer Satisfaction in Logistics? Harnessing Analytics for Results
    11 Min Read
    chatgpt image jul 13, 2026, 04 23 45 pm
    How Data Analytics Helps Companies Improve User Engagement
    19 Min Read
    chatgpt image jul 13, 2026, 03 59 46 pm
    How Data Analytics Improves Multi-Location Search Strategies
    10 Min Read
  • Big Data
  • BI
  • Exclusive
  • IT
  • Marketing
  • Software
Search
© 2008-25 SmartData Collective. All Rights Reserved.
Reading: Interactive Map of cloud services
Share
Notification
Font ResizerAa
SmartData CollectiveSmartData Collective
Font ResizerAa
Search
  • About
  • Help
  • Privacy
Follow US
© 2008-23 SmartData Collective. All Rights Reserved.
SmartData Collective > Uncategorized > Interactive Map of cloud services
Uncategorized

Interactive Map of cloud services

TheodoreOmtzigt
TheodoreOmtzigt
3 Min Read
Interactive Map of cloud services
Illustration generated with FLUX.2 [klein 4B] via Cloudflare Workers AI.
SHARE

Appirio, a company that helps enterprise customers leverage PaaS cloud platforms such as Salesforce.com and Google Apps, put a nice interactive navigator on their website.

The Appirio cloud computing ecosystem map aims to provide more clarity in the fast evolving cloud services market. It tries to help enterprise decision makers to accelerate their adoption of the cloud by trying to provide a standard taxonomy.

Ryan Nichols, head of cloud strategy at Appirio, states: “The cloud ecosystem is evolving so quickly that it’s difficult for most enterprises to keep up. We created the ecosystem map to track this evolution ourselves, and have decided to publish it to help others assess the lay of the land. With broader community involvement, we can create a living, breathing map where anyone can access, drill down and interact with dynamic information. This will bring some much-needed clarity to the cloud market.”

More Read

Calculating the Soft Costs of Hadoop
The Importance of BI Specific Skill Sets
The Third SM: Enterprise SM
The Big Data Interview: Sanjay Mirchandani, CIO
Customer Surveys and Social Media

Unfortunately, since the map is geared towards the enterprise customer it ignores all of the innovation that is taking place in the mashup, programmable web, and mid-market products. Given the new ways in which the cloud enables new application architectures and services, the enterprise market is the worst indicator of the evolving cloud ecosystem.


Share This Article
Facebook Pinterest LinkedIn
Share

Follow us on Facebook

Latest News

Flat editorial illustration: The article's core relationship is workload-by-workload decision-making for cloud migration, where s
Which Workloads Should Move to the Cloud?
Cloud Computing Exclusive IT
Flat editorial illustration: The article positions data governance as a strategic board-level concern rather than a purely techni
Why Data Governance Is Becoming a Board-Level Business Priority
Big Data Exclusive Policy and Governance
Flat editorial illustration: The article argues that data annotation quality should be measured by inspectable gold sets, written
The Top Data Annotation Companies Are Separated by Proof of Quality, Not Headcount
Big Data Exclusive
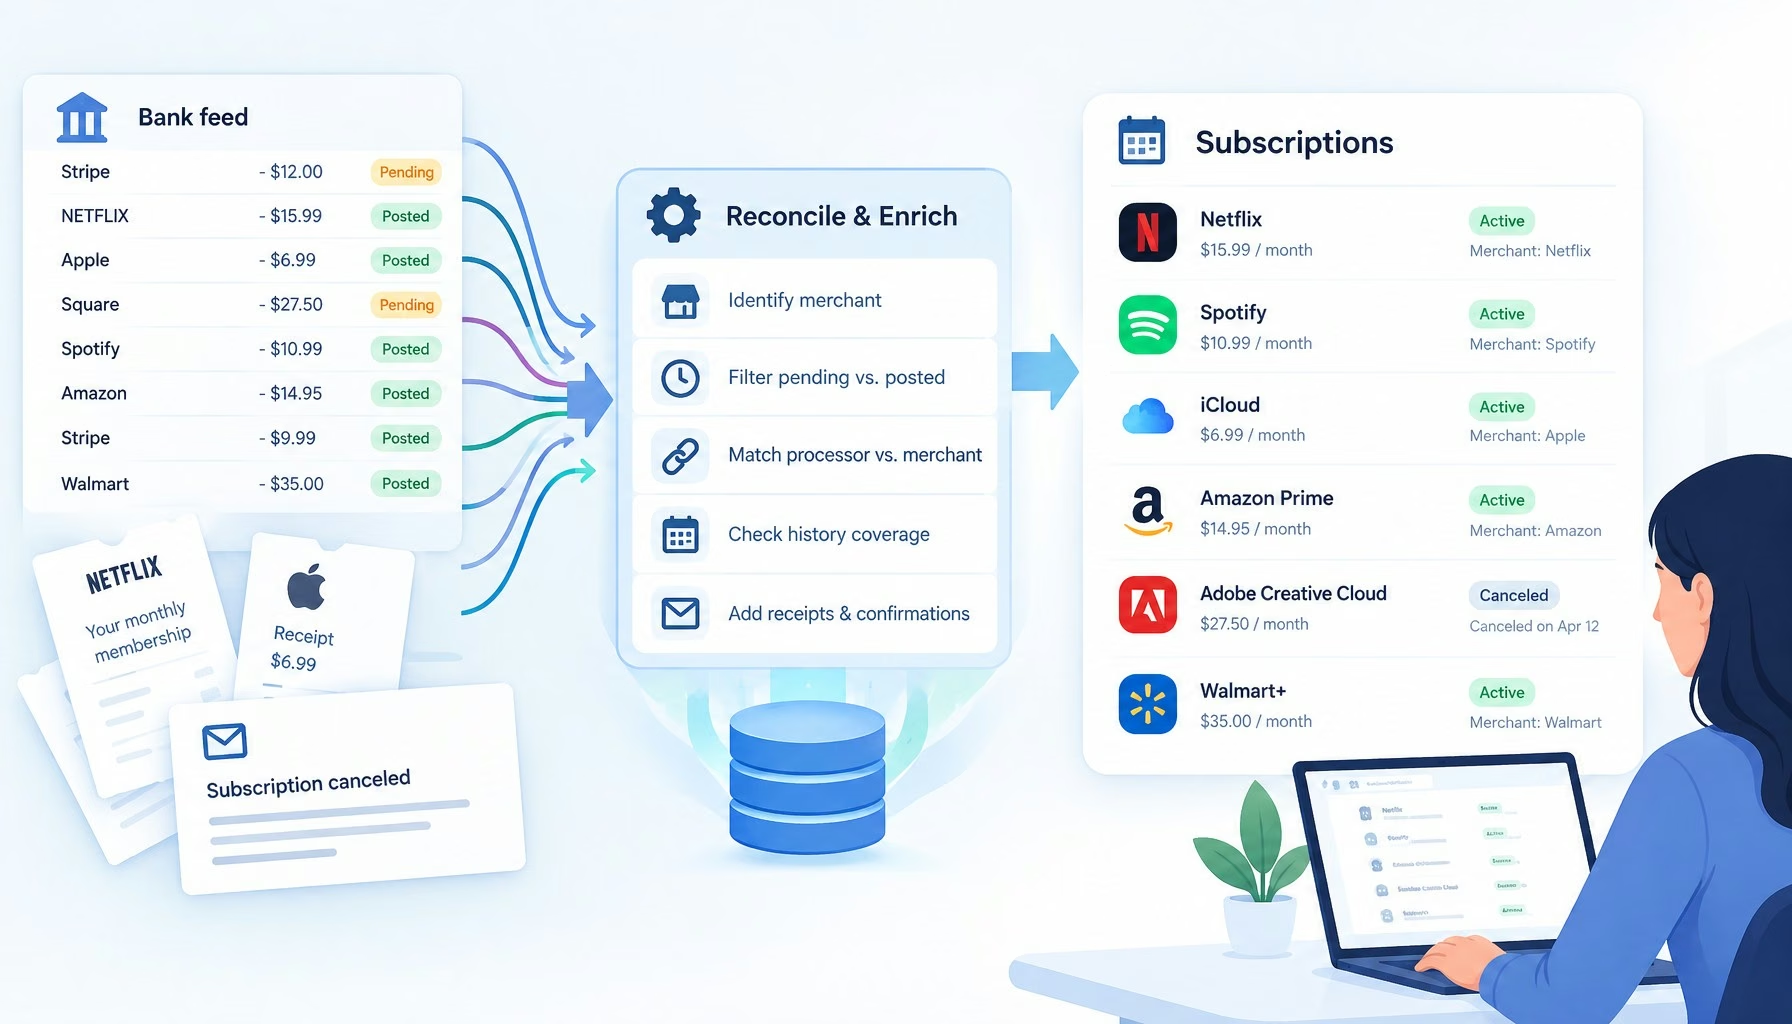
Flat editorial illustration: The article's core relationship is the gap between raw bank-feed records and reliable subscription i
Subscription Trackers Have a Transaction Data Problem
Big Data Exclusive

Stay Connected

1.2KFollowersLike
33.7KFollowersFollow
222FollowersPin

You Might also Like

IKEA Speaks the Language of Emoticons
Uncategorized

IKEA Speaks the Language of Emoticons

4 Min Read
Keep Your Data Scientist…Send Me A Data Artist!
Uncategorized

Keep Your Data Scientist…Send Me A Data Artist!

5 Min Read
Why Marketing Has a Branding Problem
Uncategorized

Why Marketing Has a Branding Problem

5 Min Read
The 3 Components of Digital Business Transformation
Uncategorized

The 3 Components of Digital Business Transformation

7 Min Read

SmartData Collective is one of the largest & trusted community covering technical content about Big Data, BI, Cloud, Analytics, Artificial Intelligence, IoT & more.

5 Great Tips for Using Data Analytics for Website UX
Big Data
Chatbots and SEO: How Can Chatbots Improve Your SEO Ranking?
Artificial Intelligence Chatbots Exclusive

Quick Link

  • About
  • Contact
  • Privacy
Follow US
© 2008-26 SmartData Collective. All Rights Reserved.
Welcome Back!

Sign in to your account

Username or Email Address
Password

Lost your password?