
If you answered “yes” to the question posed in the title, you’re right. Because if you’re talking about the open source Apache Hadoop project (and any related open source project) , you can download the software for free, take advantage of the free licensing, and run it on low-cost commodity hardware.
But if you answered “no,” you’re also right. Whereby Hadoop-related technologies can save you (lots of) money when it comes to system/infrastructure costs, those cost savings can quickly disappear when you start looking at application/development costs. It all depends on what analytic data problem you’re trying to solve.
In this post, we’ll take a look at two big data examples and determine, for each example, which platform – the enterprise data warehouse (EDW) or Hadoop – will be the most cost-effective over time. I will then introduce you to the Total Cost of Data (TCOD) framework, and show you where you can download it for free.
Two Big Data Examples
These two examples come from WinterCorp’s Big Data – What Does It Really Cost? special report, which introduces the Total Cost of Data (TCOD) framework. The first example is building an enterprise data warehouse, and the second example is building a data refinery. We’ll first look at the requirements for each example, and then compare the costs. Again, the question we want to answer is: Which platform – the EDW or Hadoop – is the most cost-effective over time?
More Read
Example 1: Build a Data Warehouse
- Objective: Build an enterprise data warehouse for a large financial institution
- Data volume: 500 TB
- Business requirements:
- Large number of data sources, users, complex queries, analyses and analytic applications
- Data integration and integrity
- Reusability and agility to accommodate rapidly changing business requirements and long data life
Example 2: Build a Data Refinery
- Objective: Refine the sensor output of large industrial diesel engines
- Data volume: 500 TB
- Business requirements:
- Rapid, intensive processing of a small number of closely-related data sets
- Analysis reads the entire dataset
- Life of the raw data is relatively short
- Small group of experts collaborate on analysis
Cost Comparison: A 5-Year Summary
These results may surprise you. Keep in mind that the results are just estimates (because a lot of assumptions have to be made), but these estimates trump anecdotal guesses any day.
Example 1: WINNER—Data warehouse
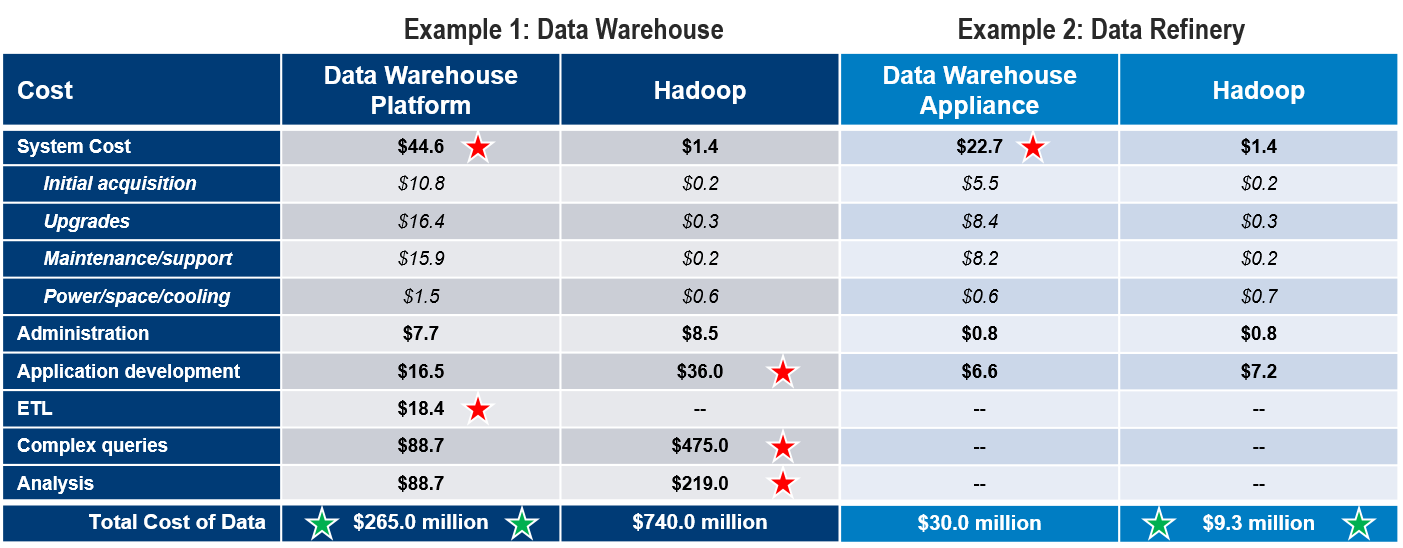
The data warehouse platform ($265 million) is far more cost-effective than a Hadoop solution ($740 million). Choosing the data warehouse platform in this case lowers the overall cost by a factor of 2.8. Further analysis shows that you will get essentially the same result for a data warehouse ranging in size from 50 TB to 2 PB.
The development of complex queries and analytics are the dominant cost factors in the example. Of the $44 million estimated for EDW system cost, $10.8 million is the initial acquisition cost – about 4% of the TCOD.
While it is common to focus on the first major outlay in the project—i.e., the acquisition of a platform—the total cost of the project is far more important, and other factors greatly outweigh all the system costs combined.
Example 2: WINNER—Hadoop
Hadoop ($9.5 million) is a far more cost-effective solution than a data warehouse appliance ($30 million). The system cost for the data warehouse appliance is the dominant factor in this case. Note the inclusive concept of the system cost and its breakdown in the table above, where just $5.5 million of the $22.7 million system cost for the data warehouse appliance is incurred in the first year.
About the Total Cost of Data (TCOD) Framework
The purpose of the TCOD framework is to help organizations estimate the total cost of a big data solution for an analytic data problem. It considers two major platforms for implementing big data analytics – the enterprise data warehouse and Hadoop – and helps you understand where each big data platform architecture works best.
In addition to the expected system costs for each platform, the TCOD framework also considers the cost of using the data over a period of time, typically five years. These usage costs include system and data administration, data integration, and the development of queries, procedural programs and analytic applications.
The TCOD framework was developed by Richard Winter and his team at WinterCorp, a consultancy focused on large scale data management challenges. WinterCorp introduced the TCOD framework in a 2013 special report called Big Data – What Does It Really Cost?.
Download the Free TCOD Report and Spreadsheet
In addition to the special report, WinterCorp also released a TCOD spreadsheet—the same one used to calculate the costs in the examples above. It’s an extensive Excel workbook that is well-documented and ready to use.
So if you’re ready to roll up your sleeves and do the hard work of figuring out what big data really costs, then the TCOD framework is waiting for you.
- TCOD Special Report: http://www.wintercorp.com/tcod-report
- TCOD Spreadsheet: http://www.wintercorp.com/tcod-spreadsheet