
In this article, we are going to discuss about why to choose Python for data science. We’ll introduce PixieDust, an open source library, that focuses on three simple goals:
- Democratize data science by lowering the barrier to entry for non-data scientists
- Increase collaboration between developers and data scientists
- Make it easier to operationalize data science analytics
Why Choose Python?
Like many developers, when it came to building data-intensive projects, using Python wasn’t my first choice. To be honest, having worked with Java for so many years, Scala seemed much more attractive to me at first, even though the learning curve was pretty steep. Scala is a very powerful language that elegantly combines object-oriented and functional programming, which is sorely lacking in Java (at least until Java 8 started to introduce Lambda expressions).
Scala also provides a very concise syntax that translates into fewer lines of code, higher productivity, and ultimately fewer bugs. This comes in handy, especially when a large part of your work is to manipulate data. Another reason for liking Scala is the better API coverage when using big data frameworks like Apache Spark, which are themselves written in Scala. There are also plenty of other good reasons to prefer Scala, like a strongtyped system, interoperability with Java, online documentation, and high performance.
So, for a developer like myself starting to get involved in data science, Scala would seem like a more natural choice, but yet, spoiler alert, we ended up focusing on Python instead. There are multiple reasons for this choice:
- Python, as a language, has a lot going on for itself too. It is a dynamic programming language with similar benefits to Scala like functional programming, concise syntax, etc.
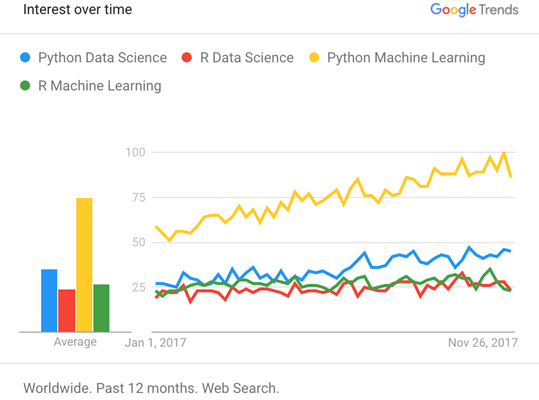
- Python has seen, over the last few years, a meteoric rise among Data Scientists, overtaking longtime rival R as the overall preferred language for Data Science as shown by a quick search for the terms Python Data Science, Python Machine Learning, R Data Science and R Machine Learning on Google Trend:
In a virtuous circle, Python’s rising popularity fuels a vast and growing ecosystem of wide-ranging libraries that can be easily imported into your projects using the PIP Python package installer. Data Scientists now have access to many powerful open-source Python libraries like Data manipulation, Data Visualization, Statistics, Mathematics, Machine Learning, Natural Language Processing and much more.
Even beginners can quickly build a Machine Learning classifier using the popular Scikit-learn package without being a Machine Learning expert, or quickly plot rich charts using Matplotlib or Bokeh.
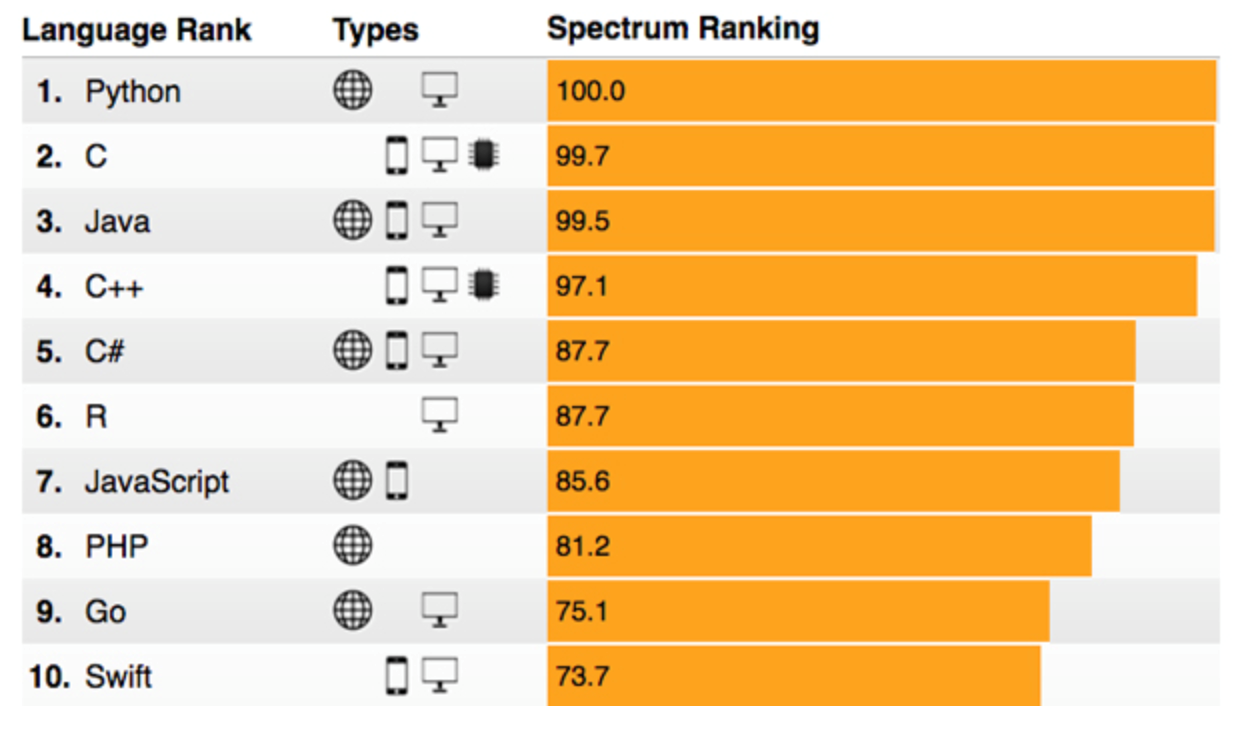
In addition, Python has also emerged as one of the top languages for developers as shown in this IEEE Spectrum 2017 survey:
This trend is also confirmed on GitHub where Python is now number three in the total number of repositories, just behind Java and JavaScript:
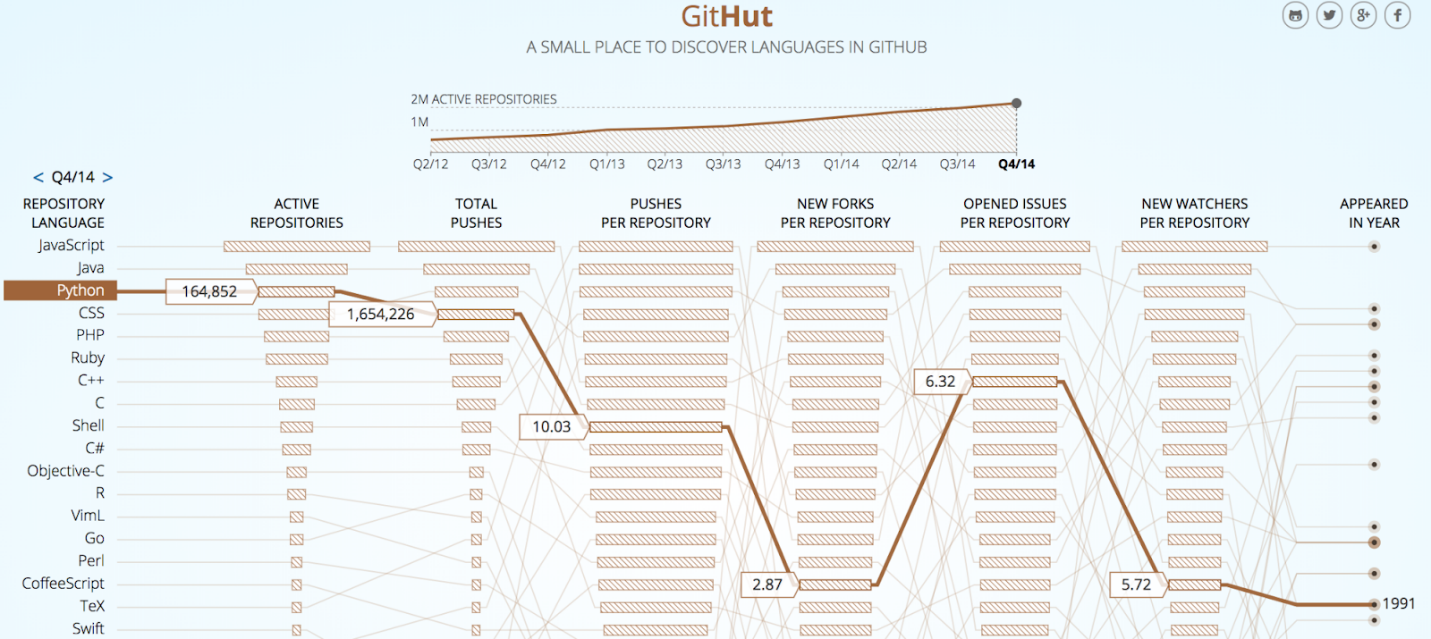
The chart above shows some interesting statistics demonstrating how active the Python developer community is. Python related repositories active on GitHub are the third biggest in size, with similarly healthy total code pushes and opened issues per repository.
Python has also become ubiquitous on the web powering numerous high-profile websites with Web development frameworks like Django, Tornado, and TurboGears. More recently, there are signs that Python is also making its way into the field of cloud services with all major cloud providers including it in some capacity in their offerings.
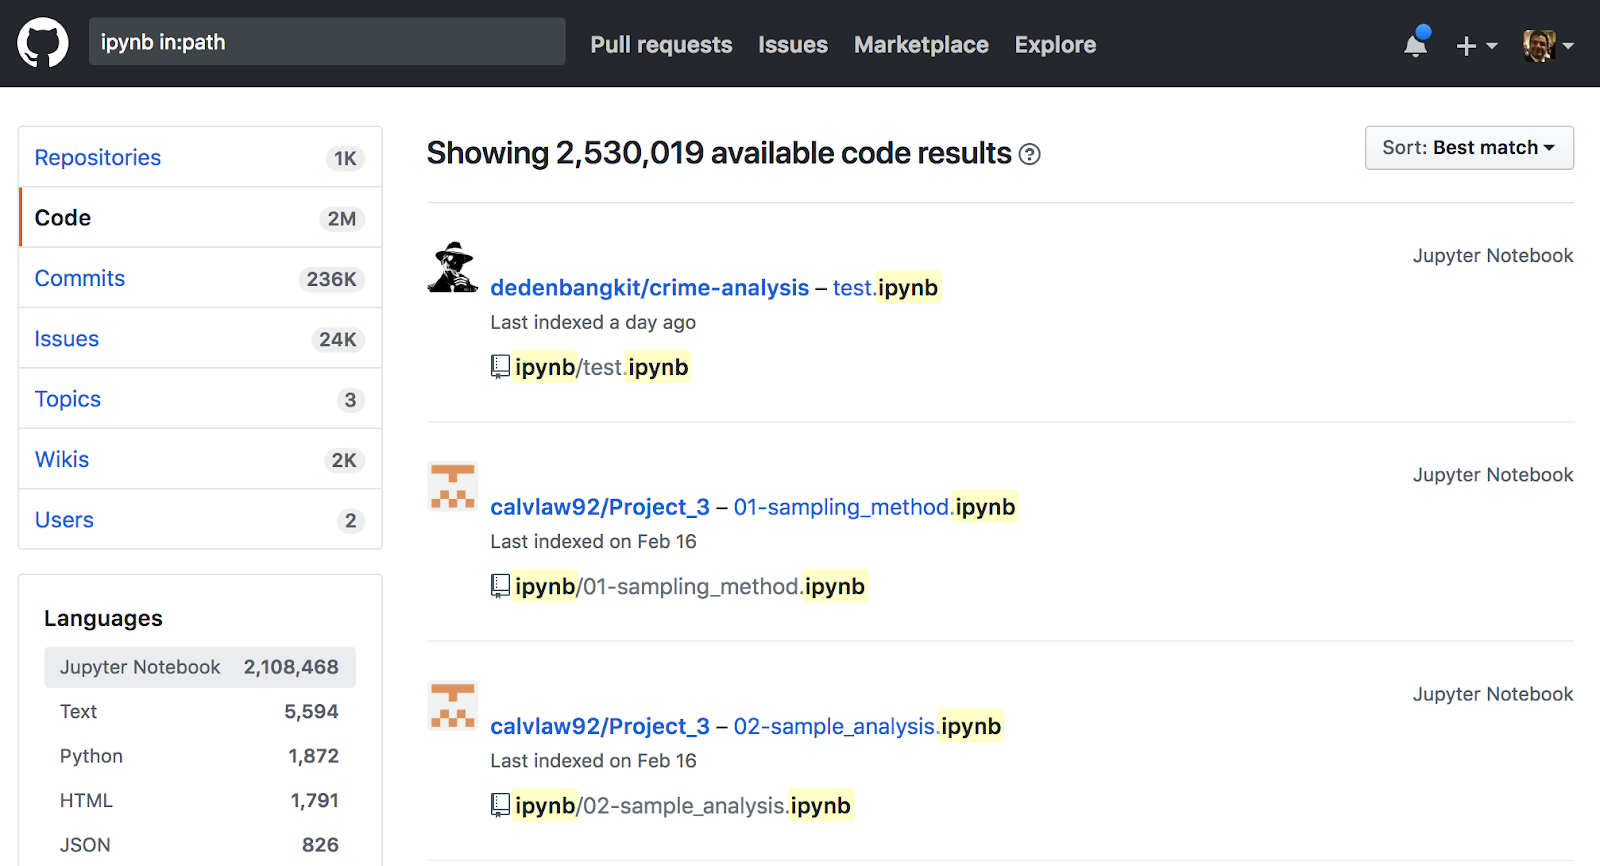
Python obviously has a bright future in the field of data science, especially when used in conjunction with powerful tools such as Jupyter Notebooks, which have become very popular in the data scientist community. The value proposition of Notebooks is that they are very easy to create and perfect for quickly running experiments. In addition, Notebooks support multiple high-fidelity serialization formats that can capture instructions, code, and results, which can then very easily be shared with other data scientists on the team or as open source for everyone to use. For example, we’re seeing an explosion of Jupyter Notebooks being shared on GitHub with more than 2.5 Million and counting.
The screenshot below shows the result of a GitHub search for any file with the extension ipynb which is the most popular format for serialized Jupyter Notebooks (JSON format):
This is great, but Jupyter Notebooks are too often thought of as data scientist tools only. We’ll see in the coming chapters that they can be much more and that they can also help all types of teams solve data problems. For example, they can help Business Analysts quickly load and visualize a data set, enable Developers to work with data scientists directly within a Notebook to leverage their analytics and build powerful dashboards or allow DevOps to effortlessly deploy these dashboards into scalable, enterprise-ready micro-services that can run as standalone Web applications or embeddable components. It is based on this vision of bringing the tools of Data Science to non-Data Scientists that the PixieDust open source project was created.
Introducing PixieDust
I am often asked how I came up with the name PixieDust, for which I answer that I simply wanted to make Notebook simple, as in magical, for non-data scientists.
PixieDust is an open-source project composed primarily of three components designed to address the three goals stated at the beginning of this article:
- A helper Python library for Jupyter Notebooks that provides simple APIs to load data from various sources into popular frameworks like Pandas and Apache Spark DataFrame and then to visualize and explore the dataset interactively.
- A simple Python-based programming model that enables developers to “productize” the analytics directly into the Notebook by creating powerful dashboards called PixieApps. As we’ll see in the next chapters, PixieApps are different from traditional BI (Business Intelligence) dashboards because developers can directly use HTML and CSS to create an arbitrary complex layout. In addition, they can embed in their business logic access to any variable, class or function created in the Notebook.
- A secure microservice web server called PixieGateway that can run PixieApps as standalone web applications or as components that can be embedded into any websites. PixieApps can easily be deployed from the Jupyter Notebook using a graphical wizard and without requiring any code changes. In addition, PixieGateway support sharing of any charts created by PixieDust as embeddable web pages allowing Data Scientists to easily communicate results outside of the Notebook.
It is important to note that PixieDust “display()” supports primarily two popular data processing frameworks:
- Pandas: by far the most popular python data analysis package. Pandas provides two main data structures: DataFrame for manipulating two-dimensional table-like datasets and Series for own-dimensional column-like datasets.
Currently, only Pandas DataFrames are supported by PixieDust “display()”.
- Apache Spark DataFrame: High-level data structure for manipulating distributed datasets across a Spark Cluster. Spark DataFrames are built on top of the lower-level RDD (Resilient Distributed Dataset) with the added functionality that it supports SQL Queries.
Another less commonly used format supported by PixieDust “display()” is an array of JSON objects. In this case, PixieDust will use the values to build the rows and keys are used as columns.
For example:
my_data = [

{“name”: “Joe”, “age”: 24},

{“name”: “Harry”, “age”: 35},

{“name”: “Liz”, “age”: 18},

…

]
In addition, PixieDust is highly extensible both at the data handling and rendering level. For example, you can add new data types to be rendered by the visualization framework or if you want to leverage a plotting library you particularly like, you can easily add it to the list of renderers supported by PixieDust (see next chapters for more details).
You will also find that PixieDust contains a few extra utilities related to Apache Spark like:
- PackageManager: lets you install Spark packages inside a Python notebook
- Scala Bridge: let you use Scala directly in a Python notebook using the %%scala magic. Variables are automatically transferred from Python to Scala and vice-versa.
- Spark Job Progress Monitor: Track the status of any Spark job by showing a progress bar directly in the cell output.
You’ve read an excerpt from Packt Publishing’s upcoming book Thoughtful Data Science. This book will not only serve the budding data scientist and developer with an interest in developing their skills or to become a professional Data Scientist, but also be great desk companion for the already accomplished Data Scientist and will be out soon.


