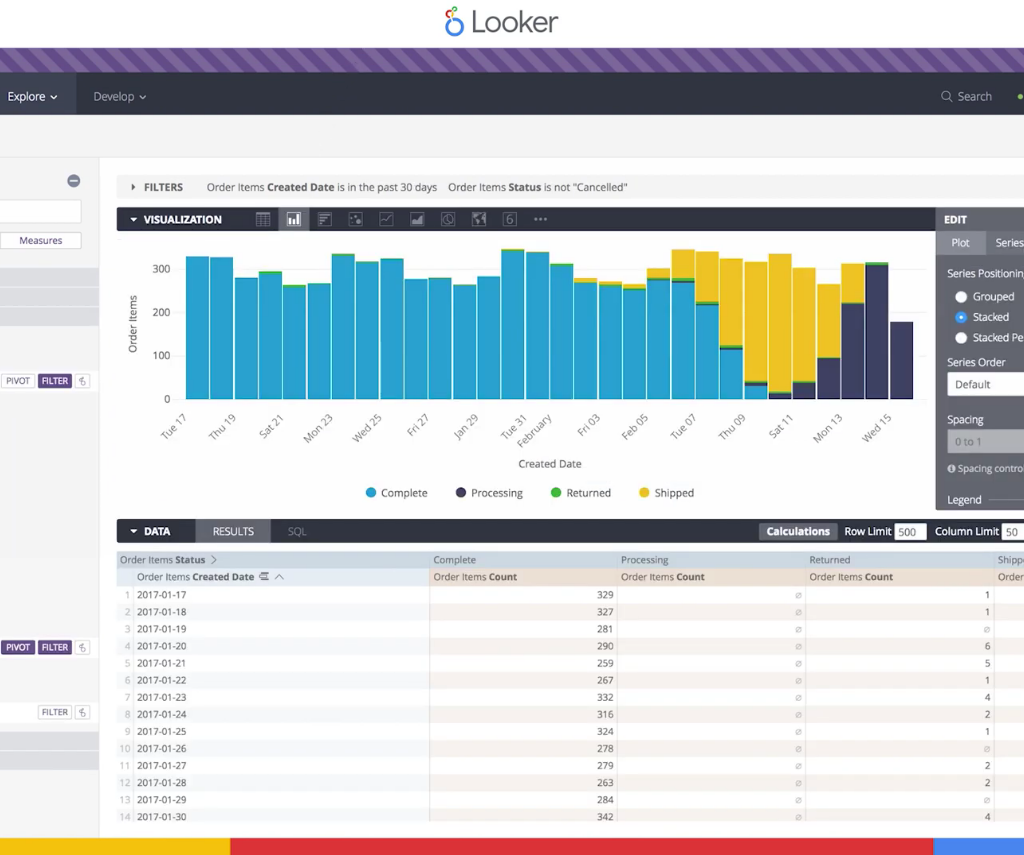
How companies gather, manage and control data has undeniably become one of the most important aspects of business success today. It’s estimated that every human being creates at least 1.7 MB of data per second, and with each click, swipe, view, purchase, and shipment, your business collects more information on its customers that you can use to help manage your business more efficiently and drive more revenue.
However, the value of the data you gather is determined by the quality of the insights you derive from it and how successfully you can incorporate these insights into your company’s infrastructure and future business strategies.
This is precisely why many business owners turn to data platform solutions such as Looker in order to leverage their data faster using powerful databases. This allows them to define business metrics that the entire company can agree and rely on so employees can analyze and explore data sets at their own leisure. This helps companies extract the maximum amount of value from their data sets. As any good data analyst will tell you, you should always push your computation to where your data lives, and that’s exactly what Looker does.
However, what do you do if your Looker is running slowly or regularly struggling with performance issues? Fortunately, there are a few quick fixes that you can try to help optimize looker performance and improve dashboard load times. Let’s jump into four of them below:

1 – Limit the number of dashboard elements
While there is no hard and fast rule for how many elements should be on your Looker dashboard, it’s safe to assume that dashboards with more items will take longer to load due to largely increased memory consumption. According to Looker themselves, dashboards with 25 or more tiles are problematic when it comes to performance, so try to keep your dashboards below that figure.
2 – Leverage caching
When available and approved by your caching policy, Looker lessens the burden on your database and increases performance by utilizing cached results of previous searches. On the other hand, complex queries can be saved as persistent derived tables (PDTs), which store the results and make subsequent queries easier, which can significantly help improve load times.
It’s also possible to employ extra caching or materialized views in the data warehouse in addition to caching in Looker (depending on the capability of your data warehouse). This is another great way of reducing load times, especially if you don’t have frequent updates to the database and frequently execute repetitive searches. However, caching is usually ineffective for interactive and ad hoc searches – something to bear in mind.
3 – Aggregate your data
Looker has an integrated feature called “aggregate awareness” that you may use to generate roll-ups or summary tables that Looker can utilize for queries whenever possible, especially for typical queries in large databases. You can also use aggregate awareness to dramatically boost entire dashboards’ performance, which significantly improves load times.
You may now pre-construct aggregate tables to various levels of granularity, dimensionality, and aggregation and tell Looker how to use them within existing Explores, thanks to Looker’s aggregate awareness. Without any user input, queries will use these roll-up tables where Looker deems appropriate. This will reduce query size, wait times, and improve the overall user experience.
One added tip is to aggregate your data before loading it into Looker or in the data warehouse to reduce the amount of data loaded onto the platform. This helps to boost performance, but one of the downsides is that you won’t be able to drill down unless you also have the original fact table in the data warehouse. If this is a problem, then stick to the aggregate awareness tool on Looker itself.
4 – Upgrade your data warehouse
While there are certainly some tweaks you can make on Looker to improve its performance, sometimes doing so is the wrong approach entirely. You see, as the amount of data companies are gathering has exploded, and as a result, Looker dashboards have slowed down significantly. However, this isn’t always an issue with Looker itself; it’s often an issue with your data warehouse.
The fact of the matter is Looker will never be able to solve at scale because it must wait for queries to complete on the data warehouse side. This creates a bottleneck as many of the cloud data warehouse solutions are simply too slow to keep up.
To get around this, search for a provider that uses query optimization, indexing, and multi-level pushdown optimization that are all optimized for Looker SQL. This should see dashboard load times increase dramatically.
Final word
Thanks to Looker, companies can use their massive data sets to derive integrated insights into their business that allows teams to make more effective, data-informed decisions. These insights can then be served up real-time dashboards for more in-depth, consistent analysis, which is why Looker must always be performing at its best.
With that in mind, if any of your dashboards are taking longer than a few seconds to load and are experiencing performance issues, you should investigate whether any of the solutions listed above will assist. However, most of the time, the problem isn’t with Looker; instead, it’s with your data warehouse. So, before you start endlessly fiddling with Looker’s settings, ensure your data warehouse provider is up to date and optimized for Looker SQL.


