One of the key findings in our latest benchmark research into predictive analytics is that companies are incorporating predictive analytics into their operational systems more often than was the case three years ago. The research found that companies are less inclined to purchase stand-alone predictive analytics tools (29% vs 44% three years ago) and more inclined to purchase predictive analytics built into business intelligence systems (23% vs 20%), applications (12% vs 8%), databases (9% vs 7%) and middleware (9% vs 2%).
One of the key findings in our latest benchmark research into predictive analytics is that companies are incorporating predictive analytics into their operational systems more often than was the case three years ago. The research found that companies are less inclined to purchase stand-alone predictive analytics tools (29% vs 44% three years ago) and more inclined to purchase predictive analytics built into business intelligence systems (23% vs 20%), applications (12% vs 8%), databases (9% vs 7%) and middleware (9% vs 2%). This trend is not surprising since operationalizing predictive analytics – that is, building predictive analytics directly into business process workflows – improves companies’ ability to gain competitive advantage: those that deploy predictive analytics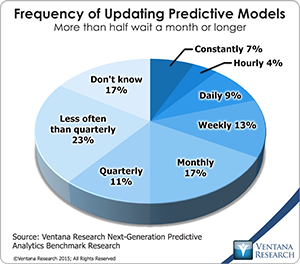 within business processes are more likely to say they gain competitive advantage and improve revenue through predictive analytics than those that don’t.
In order to understand the shift that is underway, it is important to understand how predictive analytics has historically been executed within organizations. The marketing organization provides a useful example since it is the functional area where organizations most often deploy predictive analytics today. In a typical organization, those doing statistical analysis will export data from various sources into a flat file. (Often IT is responsible for pulling the data from the relational databases and passing it over to the statistician in a flat file format.) Data is cleansed, transformed, and merged so that the analytic data set is in a normalized format. It then is modeled with stand-alone tools and the model is applied to records to yield probability scores. In the case of a churn model, such a probability score represents how likely someone is to defect. For a marketing campaign, a probability score tells the marketer how likely someone is to respond to an offer. These scores are produced for marketers on a periodic basis – usually monthly. Marketers then work on the campaigns informed by these static models and scores until the cycle repeats itself.
The challenge presented by this traditional model is that a lot can happen in a month and the heavy reliance on process and people can hinder the organization’s ability to respond quickly to opportunities and threats. This is particularly true in fast-moving consumer categories such as telecommunications or retail. For instance, if a person visits the company’s cancelation policy web page the instant before he or she picks up the phone to cancel the contract, this customer’s churn score will change dramatically and the action that the call center agent should take will need to change as well. Perhaps, for example, that score change should mean that the person is now routed directly to an agent trained to deal with possible defections. But such operational integration requires that the analytic software be integrated with the call agent software and web tracking software in near-real time.
Similarly, the models themselves need to be constantly updated to deal with the fast pace of change. For instance, if a telecommunications carrier competitor offers a large rebate to customers to switch service providers, an organization’s churn model can be rendered out of date and should be updated. Our research shows that organizations that constantly update their models gain competitive advantage more often than those that only update them periodically (86% vs 60% average), more often show significant improvement in organizational activities and processes (73% vs 44%), and are more often very satisfied with their predictive analytics (57% vs 23%).
Building predictive analytics into business processes is more easily discussed than done; complex business and technical challenges must be addressed. The skills gap that I recently wrote about is a significant barrier to implementing predictive analytics. Making predictive analytics operational requires not only statistical and business skills but technical skills as well. From a technical perspective, one of the biggest challenges for operationalizing predictive analytics is accessing and preparing data which I wrote about. Four out of ten companies say that this is the part of the predictive analytics process  where they spend the most time. Choosing the right software is another challenge that I wrote about. Making that choice includes identifying the specific integration points with business intelligence systems, applications, database systems, and middleware. These decisions will depend on how people use the various systems and what areas of the organization are looking to operationalize predictive analytics processes.
For those that are willing to take on the challenges of operationalizing predictive analytics the rewards can be significant, including significantly better competitive positioning and new revenue opportunities. Furthermore, once predictive analytics is initially deployed in the organization it snowballs, with more than nine in ten companies going on to increase their use of predictive analytics. Once companies reach that stage, one third of them (32%) say predictive analytics has had a transformational impact and another half (49%) say it provides a significant positive benefits.