
What is data science?
- Where to start?
- 1. The Fundamentals
- Mathematics
- Linear Algebra
- Probability
- Probability distributions
- Statistics
- Programming Language (R or Python)
- 2. Exploratory Data Analysis
- 3. Basics of Machine Learning
- Supervised
- Unsupervised
- Reinforcement
- Semi-Supervised Learning
- Regression (Supervised)
- Classification (Supervised)
- Clustering (Unsupervised)
- Anomaly Detection (Semi-Supervised)
- Association Rule Mapping (Semi-Supervised)
- 4. Deep Learning
- 5. Advanced Machine Learning
- 6. Complimentary skills
- 7. Use cases of data science.
- 8. Building Profile
Data science is analyzing and predicting data, It is an emerging field. Domain experts of all fields use it. Some of the applications of data science are driverless cars, gaming AI, movie recommendations, and shopping recommendations. Since the field covers such a vast array of services, data scientists can find a ton of great opportunities in their field.
Data scientists use algorithms for creating data models. These data models predict outcomes of new data.
Data science is one of the highest-paid jobs of the 21st century.
More Read

Where to start?
Data science needs knowledge from a variety of fields including statistics, mathematics, programming, and transforming data. So, the overwhelming question for beginners is – Where to start?
Here are the chronological steps for the data science journey.
1. The Fundamentals
First of all, it is important to understand what data science is and is not. Data science should not be used synonymously with data mining. The two concepts overlap but are different in many ways.
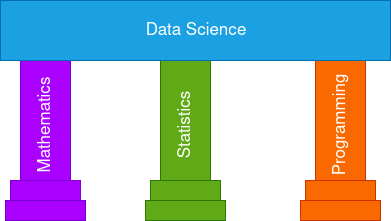
Mathematics, statistics, and programming are pillars of data science.
Mathematics
The following branches of mathematics are important for data science.
Linear Algebra
Linear algebra is the study of linear equations and graphs of linear equations. Linear algebra is the foundation for many other branches of mathematics. In data science, use linear algebra for understanding the statistical graphs.
Probability
Probability is the measurement of the likelihood of events. It is the building block of statistics. It helps in understanding the statistical outcomes.
Probability distributions
Probability distributions are collections of all events and their probabilities. Knowledge of probability distributions is needed for understanding and predicting data.
Statistics
Statistics is understanding, interpreting, and presenting data. Basic knowledge of statistics is essential for data science.
Statistics is broadly categorized into two types –
Descriptive statistics – Descriptive statistics is describing the data. Visual graphs are the core of descriptive statistics.
Inferential statistics – Inferential statistics is understanding the patterns in the data. An important aspect of inferential statistics is checking whether the data patterns occurred because of random chance or the data patterns occurred because of relationships between data variables.
Programming Language (R or Python)
Programming knowledge is needed for the typical tasks of transforming data, creating graphs, and creating data models.
Programmers can start with either R or Python. For academics and domain experts, R is the preferred language. it is overwhelming to learn data science concepts and a general-purpose language like python at the same time. R being a statistical language is an easier option. Python can be added to the skill set later.
2. Exploratory Data Analysis
Exploratory data analysis is analyzing and understanding data. For exploratory data analysis use graphs and statistical parameters mean, medium, variance. Both R (ggplot2) and python (Matplotlib) have excellent graphing capabilities.
3. Basics of Machine Learning
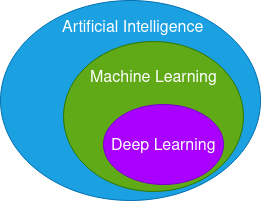
Machine learning is the science of building models automatically. It is a branch of artificial intelligence. In conventional programming, the programmer understands the business needs, data, and writes the logic. Whereas in machine learning, the algorithm understands the data and creates the logic.
Learning the various categories of machine learning, associated algorithms, and their performance parameters is the first step of machine learning.
Machine learning is broadly classified into three types –
Supervised
In supervised learning, a variable is predicted. The column or variable that is being predicted is the label variable.
Unsupervised
In unsupervised machine learning, patterns in unlabeled data are identified.
Reinforcement
In reinforcement learning the algorithm teaches itself how to complete a task. The list of rewards and risks is given as input to the algorithm. The algorithm deduces the best approaches to maximize rewards and minimize risks.
Semi-Supervised Learning
Semi-supervised learning is a combination of both supervised and unsupervised techniques. Use a small amount of labeled data to identify patterns in a large amount of unlabeled data.
Supervised, Unsupervised, and semi-supervised learning are further classified into five types based on the work done by the algorithms.
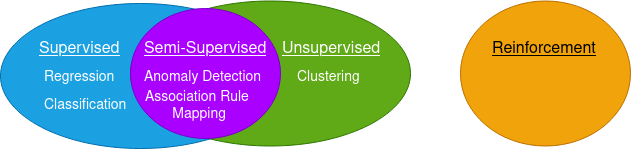
Regression (Supervised)
In regression, a numerical variable is predicted using other variables. Use regression for understanding the relationship between data and for predictions. For example, predict the stock price using the previous day’s price, market movement, and news. Another example of regression is to predict the volume of trees with tree height and tree girth.
Among regression techniques, linear regression is the most popular technique. In linear regression, the label variable is expressed as a linear equation of other variables.
Classification (Supervised)
In classification, the category of observation is predicted. For example, predict whether a student would pass an English exam by checking the grammar of assignments written by him. Similarly, we can predict whether a movie that would be released would be a blockbuster based on its genre, movie length, profits of previous movies of the directors and actors.
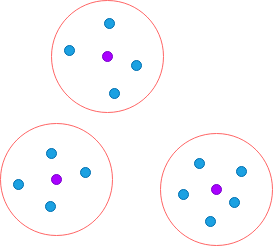
Clustering (Unsupervised)
With Clustering the data is divided into groups. The members in a group are similar to each other. For example, suppose the government decides to open health centers that are accessible to all villages. By applying clustering based on distance, the villages are divided into groups. The center of each cluster is the optimal location for setting up health centers.
The below image shows a group of clusters along with their centers.
Anomaly Detection (Semi-Supervised)
Anomaly detection is the Identification of unexpected events. One of the common use cases of anomaly detection is identifying fraudulent card transactions. Suppose a credit card transaction of an American citizen happens in India. This is an unexpected event and a red flag is raised. The customer care of the bank may call or send a message to the user to verify the transaction. In case of a valid reason like a tourism trip the transaction is accepted or else it is declined.
Association Rule Mapping (Semi-Supervised)
Association rule mapping is the Identification of co-occurring patterns. In data science terminology the co-occurring patterns are known as association rules. For example, e-commerce applications use association rule mapping for finding the groups of products that are frequently bought together. The algorithm takes previous orders as input and outputs the association rules. When one of the frequently bought, items is added to the cart, the e-commerce application would recommend other products in the group. Mozzarella cheese and pizza bases are frequently brought together. So when a user adds a pizza base to the cart, the mozzarella cheese is recommended to the user.
Similarly, when a user watches a movie from a series, the video hosting application recommends other movies from the series.
4. Deep Learning
Deep learning is a subset of machine learning that works similar to the biological brain. Use deep learning when the number of variables (columns) is high. Deep learning is used for speech recognition, board games AI, image recognition, and manipulation.
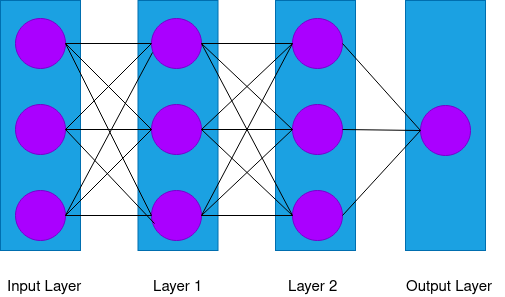
Deep learning algorithms use artificial neural networks to solve problems. The neurons are arranged in a group of layers. The output of a layer acts as input to the next layer.
The image below shows fully connected neutrons arranged in a group of layers.
5. Advanced Machine Learning
Advanced machine learning techniques give the highest accuracy. Use these techniques when the requirement is to get the best accuracy. It is fairly common to use advanced techniques in competitions. Some of the advanced machine learning techniques are –
Boosting
Boosting algorithms work incrementally by focusing on errors in the previous prediction. With each increment the accuracy of the model increases. Use boosting algorithms when the sample size is high. Some of the popular boosting algorithms are adaboost, catboost, and lightgbm.
Ensembling
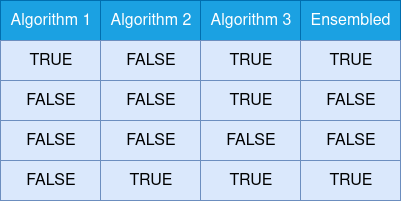
In ensembling, the outputs from different algorithms are taken as input and merged. For example, a user creates a machine learning model and a deep learning model for the same problem. The outputs of both models are merged to give the final output.
Generally, ensembling gives more accuracy than individual algorithms. Some of the common ensembling techniques are averaging outputs, selecting the most repeated output, and applying boasting on outputs.
Given below is an example of ensembling using the technique of selecting the most repeated output.
6. Complimentary skills
Along with data science, other related skills are needed to work on data science projects. Skills that are in high demand for data science positions are big data (spark), no sql (mongo db), and cloud computing. Popular options among cloud computing are amazon web services, google cloud, and Microsoft azure.
7. Use cases of data science.
It is important to learn how data science is used in real-world scenarios. Learn when to use which technique. By learning the existing use cases, the data scientist gets an idea of how to solve new use cases.
Some of the popular use cases of data science are –
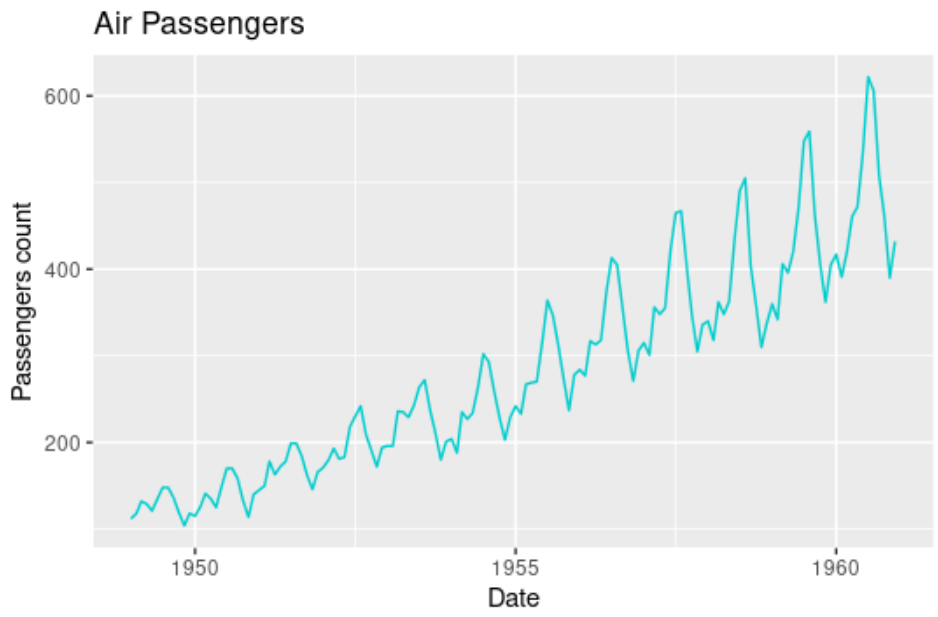
Time series
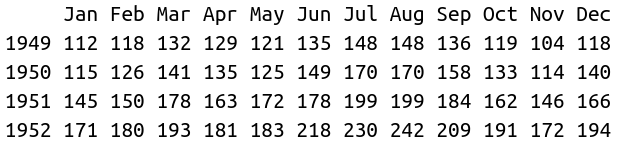
Time series is data mapped to time. In data science, various techniques are available for understanding, forecasting time series. Time series techniques give good predictions for seasonal data. For example, use time series for tides prediction, sales prediction, and stock price prediction. Some of the popular techniques for predicting time series are arima models, exponential smoothing, and prophet library from Facebook.
Given below are data and a graph of the number of airplane travelers in thousands mapped to time. From the graph, it is evident that the number of travelers peaks from June to August. As the data is seasonal, time series techniques are a good option for forecasting the number of passengers in the future.
Natural Language Processing (NLP)
Natural language processing is creating logic for understanding human languages. In some cases, the algorithm responds in human language. It involves both text and speech data. Some examples of natural language processing are instant translation, automated virtual assistants (Siri, Alexa), grammar checking, autocorrect, and auto-complete.
Sentiment analysis
Sentiment analysis is the determination of the attitude and emotion in text. For example, an algorithm would read the tweets of products and classify them into three groups – positive, neutral, and negative. The company can limit damage control by focusing on the negative comments immediately. Similarly, the company would know what features are most liked by customers.
It is a common practice to couple machine learning techniques with big data for sentiment analysis. Data from social media and news pages are read with big data tools and given as input to sentiment analysis algorithms. Nowadays, sentiment analysis algorithms are advanced enough to understand sarcasm.
Given below is a simple example of sentiment analysis.
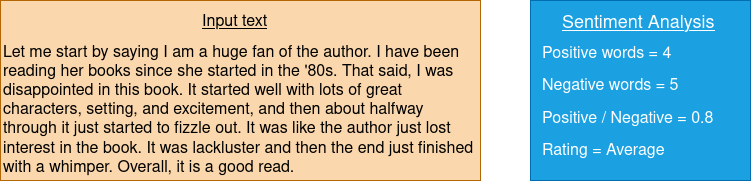
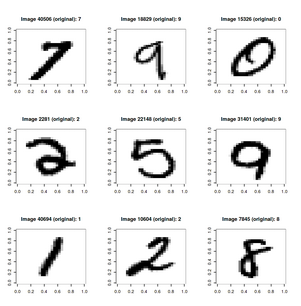
Image recognition
Image recognition is the identification of features in images. Some examples of image recognition are reading text from images, identifying the objects in images, and face recognition. Facebook and google photos identify people from images and recommend tags. Use deep learning techniques for image recognition.
For examples of reading text, the most common dataset is MNIST. The MNIST dataset contains photos of American student’s handwriting. Given below is a screenshot of the MNIST dataset.
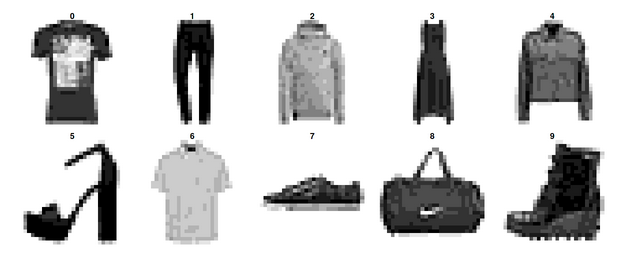
Fashion MNIST is another popular dataset for image recognition. It contains pictures of ten clothing items including shoes, trousers, bags. Given below is a screenshot of the fashion MNIST dataset.
8. Building Profile
It’s time to showcase your data science skills.
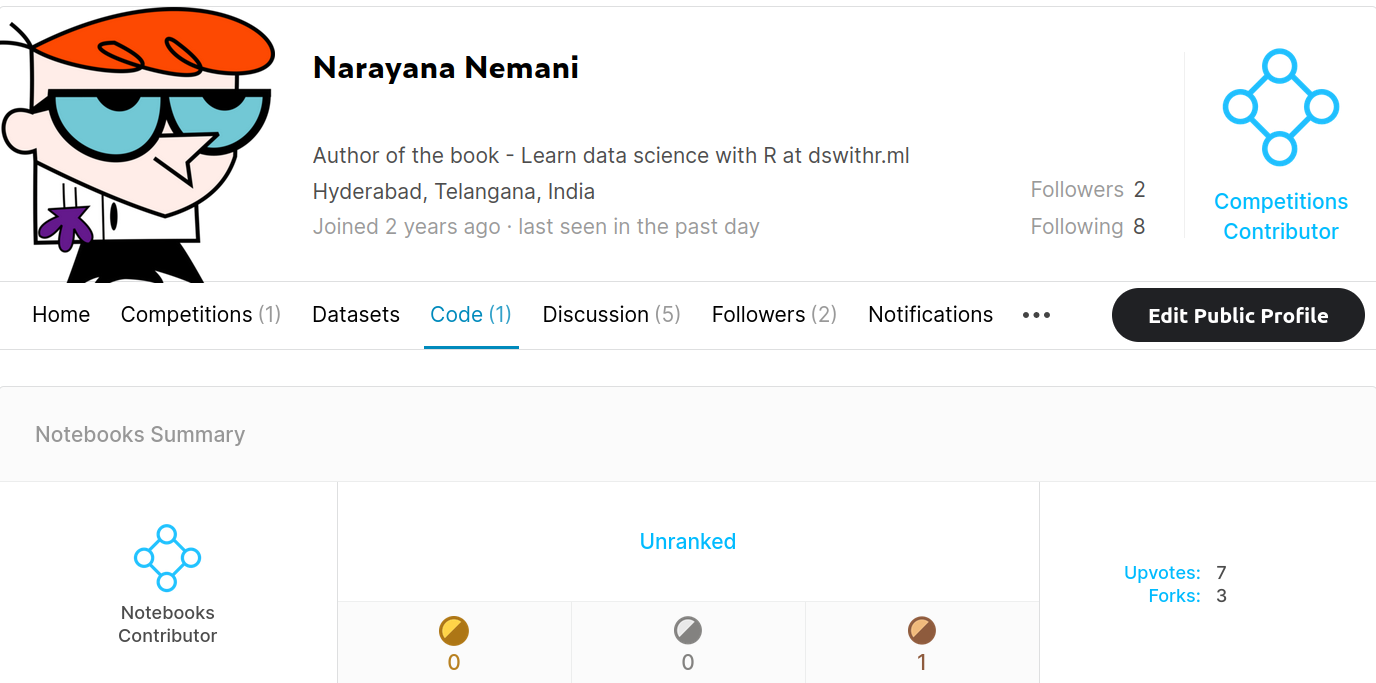
Earn Kaggle medals
Participate in kaggle competitions. Kaggle awards medals for competition scores, participating in discussions, and publishing code notebooks. Notebooks that receive more than five votes receive a bronze medal. Kaggle medals are revered by fellow data scientists and data science companies.
Given below is an image with a kaggle profile along with medals and votes.
Publish Articles
Publishing gives visibility and recognition. Data scientists are expected to communicate with other teams regarding their finds in data. Communication is one of the key tenets of data science positions. Publishing and seminars are the best ways to showcase communication skills.
Published articles are a fine addition to the resume. Publishing helps get job placements, especially for senior-level positions.
Build Resume
A good resume increases the number of opportunities. It should have a clear objective and relevant projects. Highlight the technical problems you have faced and how you fixed them. Describe how your data science work has improved the business flow.


