
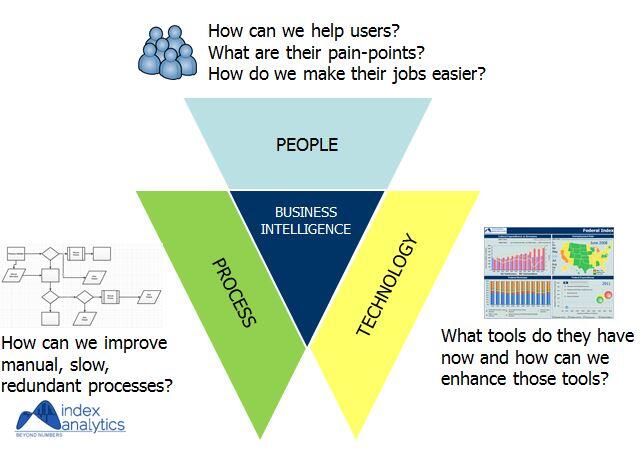

How do you assess the overall health and maturity of your Business Intelligence initiative? Big Data Analytics has recently received significant attention in the press and media. But this article is the first in a series that reviews the topics to be considered when reviewing the current status of a traditional Business Intelligence initiative. In part one, the functional areas of Data Visualization Services and Data Strategy Services are covered. In subsequent entries, Data Integration Services and BI tools and technologies will be discussed.
Data Visualization Services:
1. Enterprise-focused BI solution – Usually, BI initiatives tend to be focused on a particular functional area within an organization, and that area typically is the one that “owns” the initiative in terms of providing requirements and setting priorities. However, this introduces the problem of “data silos” and “data fiefdoms.” For example, the Sales team has their own analytics solution, but the procurement and purchasing division wants to build their own reporting solution that focuses on their specific requirements. This kind of behavior needs to be discouraged at the executive leadership level unless there is a compelling reason to go down that path. An “Enterprise-focused” BI solution should address all the data needs of the organization spanning multiple functional areas. For example, what if the senior leadership of a company wanted to know how many orders a top customer placed during a span of three months while his call center team needs to know the reason it has received an unacceptable amount of call about the quality of the product? This example involves merging sales analytics with contact center analytics and building an integrated enterprise Data Warehouse.
2. Transactional/Operational reporting vs. BI Analytics – One of the common problems encountered by Business Intelligence initiatives is that they are often needed for day-to-day transactional or operational business requirements. Though that a valid need that can be supported by the BI initiative, we recommend that the BI solution consider building multiple aggregated summary reports that help users identify trends and patterns over a period of time. This approach helps users think about the bigger picture without letting them get mired in the detailed data. In addition, this also helps in addressing the data needs of different levels of users in the organization. Not everyone in the organization might want to see every single order placed at a particular store location, or all the purchases made by the individuals in a division using the corporate card.
3. Executive Dashboards and KPI scorecards capability – This topic is similar to the previous example of accounting for different audiences of a BI solution. Executive management may have interest in tracking such items as the performance of different components of an organization or the particular goals set at the Senior Leadership level. This can be accomplished using Executive Dashboards and KPIs. These Dashboards or KPIs can be integrated into an existing intranet portal so that the entire user community can view the progress made on an overall enterprise goal. This effort typically also provides executive sponsorship for the BI initiative as well as any support for the effort from the Senior Leadership. Both can be very helpful for the overall success of the BI initiative. For more
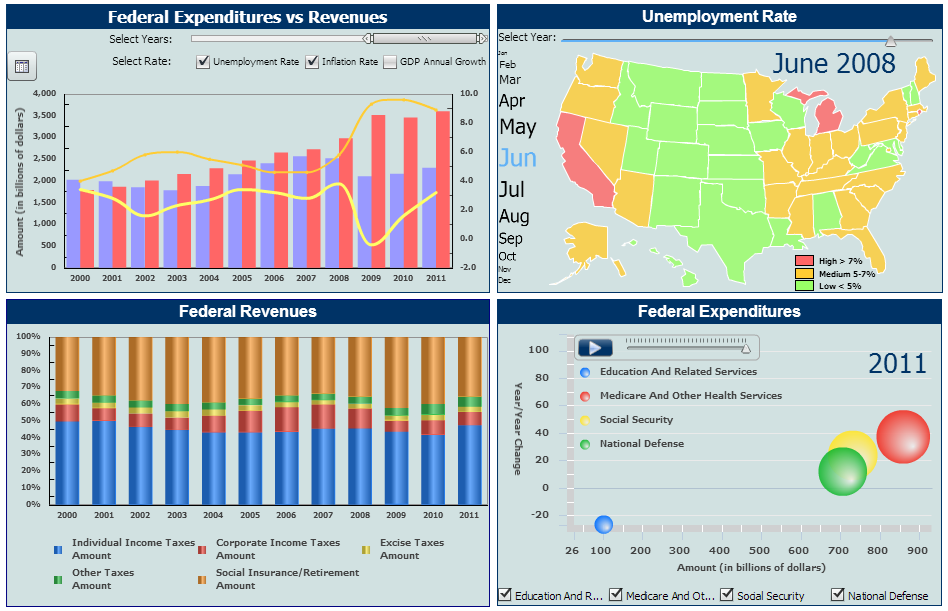
discussion about the different Data Visualization capabilities of a BI tool, please refer to the blog post written earlier.
4. Overemphasis on technology – IT organizations tend to get carried away when trying to implement the latest BI tool features and functionality. However, the emphasis needs to be placed on how the tool will enable the users in enhancing the business processes. If a particular cutting edge feature of a BI tool isn’t directly relevant to the overall data strategy of the organization, it doesn’t make sense to implement that functionality and cause additional confusion in the user community.
Data Strategy Services:
1. Enterprise-wide centralized metadata repository – We recommend that a single, enterprise-wide, centralized repository be built that contains the definitions of all the reporting objects like metrics/measures, attributes/variables and filters. Inconsistent object definitions between different groups of the same organization is a problem I’ve encountered with every organization I worked with in the past 10 years. A few years ago, one of the top manufacturing companies I was involved with couldn’t easily define a prominent metric like “Spend Amount.” Is it the amount vouchered? The amount paid? The amount invoiced? Does it include internal inter-division payments? A single metric can be defined multiple ways depending on the sub-set of the business community involved. Often, there is no repository that captures all of these definitions. Lack of object definition standardization and insufficient business user participation during the requirements gathering can be the root cause of many issues that would cause the team to spend considerable amount of time trouble-shooting and root-causing reporting issues. So, we recommend that all of the object definitions be captured at single location and shared with the entire organization for reference. This “repository” will also be helpful when you are trying to determine the set of objects impacted by a source system change.
2. BI solution utilization – It is really helpful if you can monitor the usage of the BI solution after it has been deployed. Questions such as “how many users are using the solution?”, “how frequently are they using?”, “are they using some reports/objects more than the others?” can help the BI implementation in determining the focus areas for post-deployment support of the BI solution. Monitoring the usage of the BI solution can also drive the ROI calculation of the BI initiative. Executive management could then use this to determine if a subsequent phase of the BI initiative needs to be sponsored, and if there are any lessons learned from the previously deployed BI solution.
3. Training and outreach – The BI team should consider creating extensive reference material and training content that is geared to the business users. Such a library can be used to review the content implemented in the BI solution and explore how the data is stored. Training sessions should be conducted at frequent/regular intervals, and feedback from users should be considered to constantly tune and enhance the training material. Additionally, User Guides that package all of that information together are also helpful in communicating the technical implementation of the business user’s requirements.
Finally, we really want to emphasize that BI solution implemented is not the end-game but it is just a tool or framework implemented to help the user community enhance their business processes.


