Cookies help us display personalized product recommendations and ensure you have great shopping experience.

By using this site, you agree to the Privacy Policy and Terms of Use.
Accept
SmartData CollectiveSmartData Collective
  • Analytics
    AnalyticsShow More
    media monitoring
    Signals In The Noise: Using Media Monitoring To Manage Negative Publicity
    5 Min Read
    data analytics
    How Data Analytics Can Help You Construct A Financial Weather Map
    4 Min Read
    financial analytics
    Financial Analytics Shows The Hidden Cost Of Not Switching Systems
    4 Min Read
    warehouse accidents
    Data Analytics and the Future of Warehouse Safety
    10 Min Read
    stock investing and data analytics
    How Data Analytics Supports Smarter Stock Trading Strategies
    4 Min Read
  • Big Data
  • BI
  • Exclusive
  • IT
  • Marketing
  • Software
Search
© 2008-25 SmartData Collective. All Rights Reserved.
Reading: Automatically Update Frozen Reports in Dashboards
Share
Notification
Font ResizerAa
SmartData CollectiveSmartData Collective
Font ResizerAa
Search
  • About
  • Help
  • Privacy
Follow US
© 2008-23 SmartData Collective. All Rights Reserved.
SmartData Collective > Uncategorized > Automatically Update Frozen Reports in Dashboards
Uncategorized

Automatically Update Frozen Reports in Dashboards

exploreanalytics
exploreanalytics
3 Min Read
SHARE

Many of you are embedding Explore Analytics reports on ServiceNow dashboards, as well as Sharepoint, Google Sites, or other portals.

Often, these reports are live, but in some cases you may want to display daily, weekly, or monthly generated frozen reports. If a report doesn’t need to be live (for instance, for daily or weekly calculations), it may perform more quickly with frozen data. For more information on when frozen reports might be appropriate, see this earlier blog post.

More Read

How Twitter Enhances Me
The Biggest Contradiction of Big Data
How Much Longer Until Flash Storage is the Only Storage?
Next-Gen Business Analytics Paving the Way to Success in 2015
Why Overfitting is More Dangerous than Just Poor Accuracy [PART 2]

These frozen reports can be automatically scheduled to publish on a regular basis. Now, the republished reports can use the same URL, so that you can automate replacing the frozen report in your dashboard or portal.

We’re going to walk through an example, so you can see how it works.


Let’s suppose that we have the following report, which shows to our customers how our organization performed at meeting Service Level Agreements over the past week, by priority of incident:

We’ve decided we don’t want to show our customers the week-in-progress, so we generate this each week looking at the previous week. For that reason, we’ve decided to optimize the report by generating it as a frozen report weekly.

Luckily, it’s just a few easy steps to schedule this frozen report to automatically update in the portal. That way, even though the report is static, the data will be compiled automatically and replaced in the portal without any manual effort.

Here’s how:

  1. While the report is open, navigate to File > Schedule.
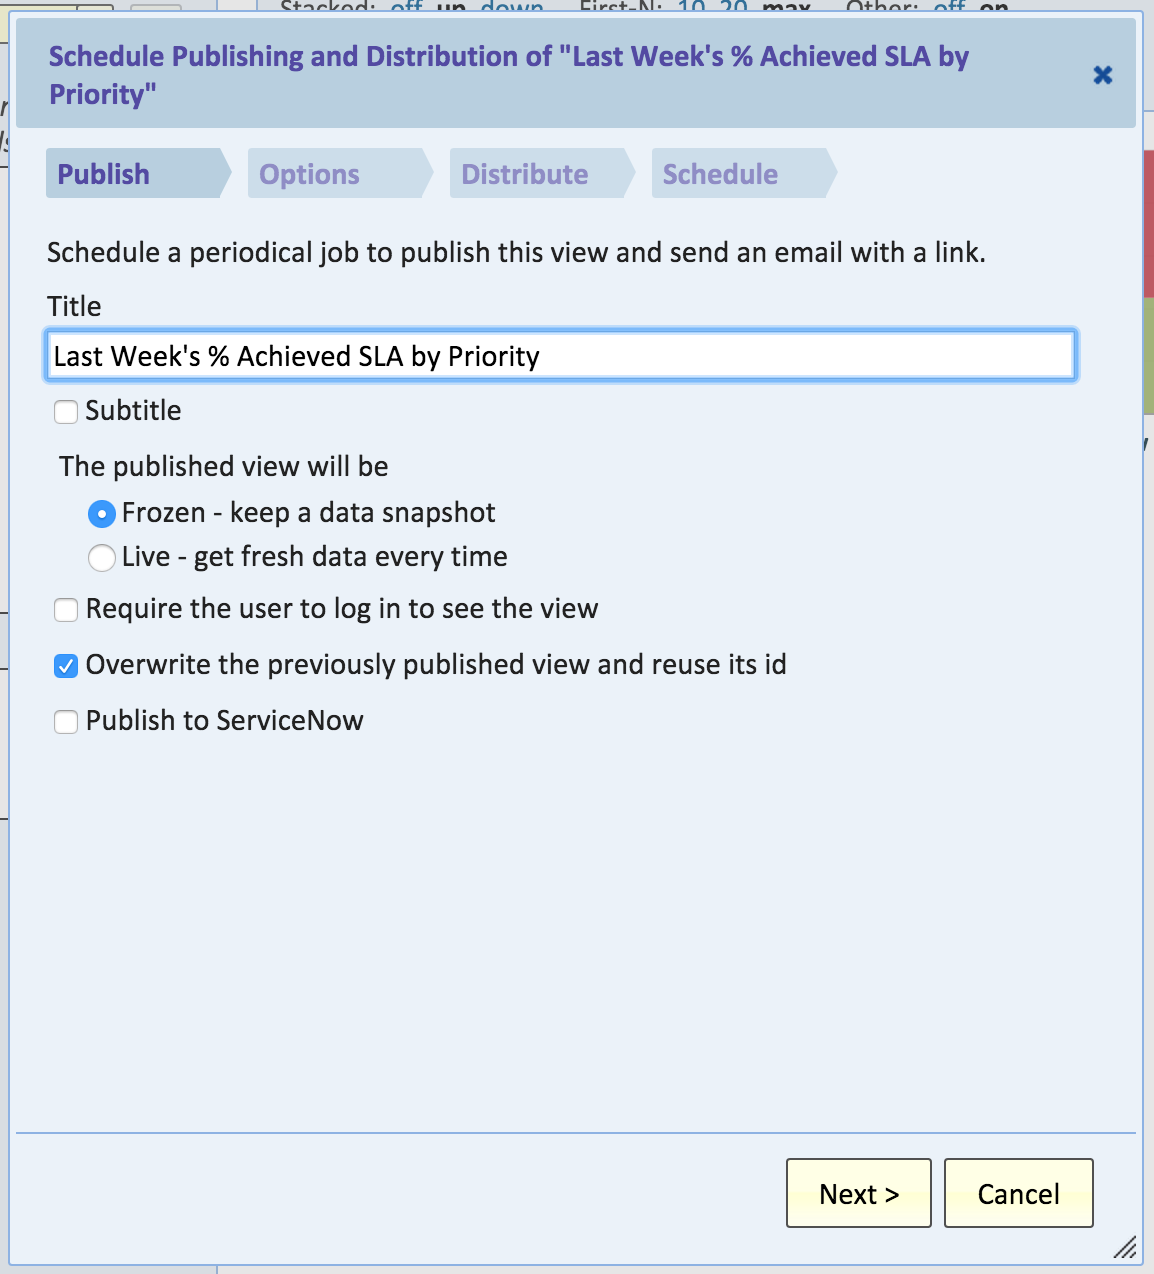
  2. In the Schedule dialog, provide a title, select Frozen – keep a data snapshot, and check Overwrite the previously published view and reuse its id:Screenshot 2015-11-02 19.17.45
  3. Click the Next dialog to set the Options for the report, and Next again to define distribution. You can leave the email information blank.
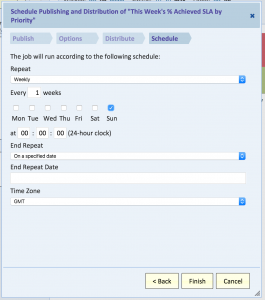
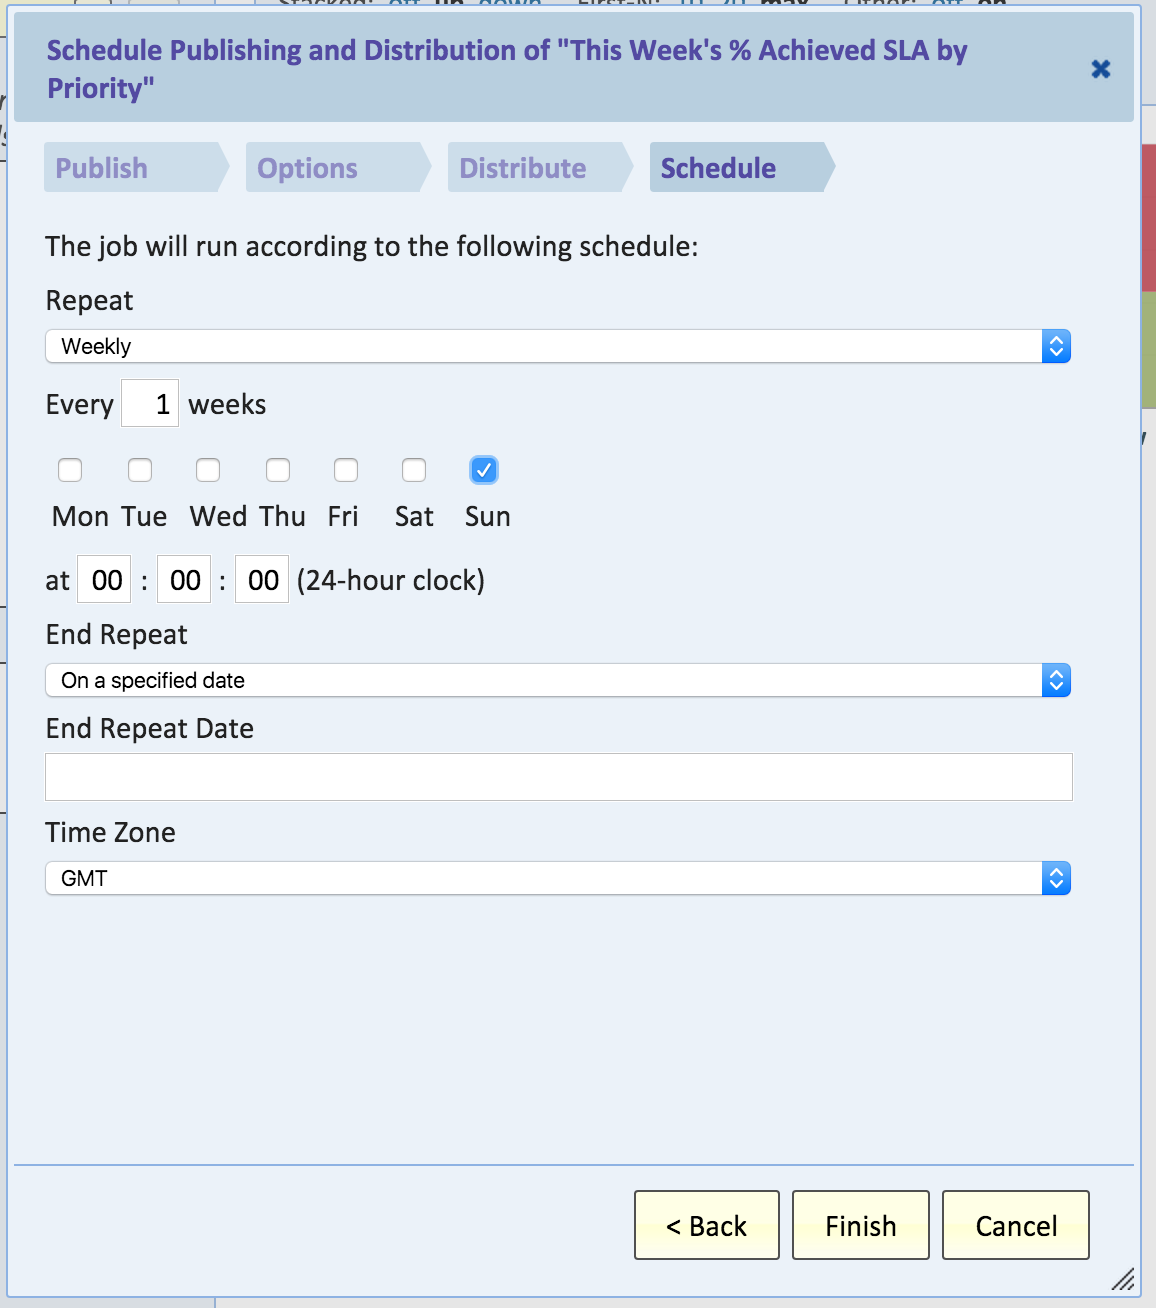
  4. On the Schedule tab, define how frequently you want the data to update. In this example, set it to “Weekly” to update the data at the end of each week:Screenshot 2015-11-02 19.15.57
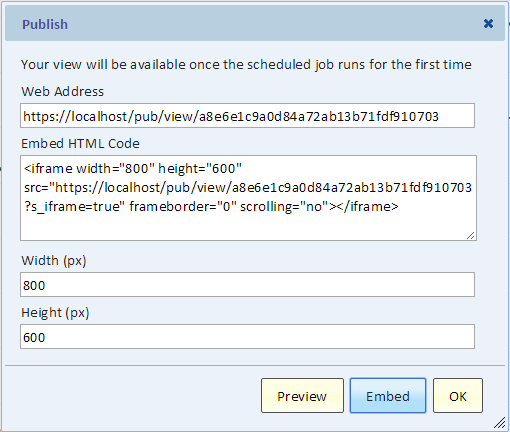
  5. Click Finish. You’ll be presented with the HTML embed information and the URL.
Share This Article
Facebook Pinterest LinkedIn
Share

Follow us on Facebook

Latest News

NO-CODE
Breaking down SPARC Emulation Technology: Zero Code Re-write
Exclusive News Software
online business using analytics
Why Some Businesses Seem to Win Online Without Ever Feeling Like They Are Trying
Exclusive News
edi compliance with AI
AI Is Transforming EDI Compliance Services
Exclusive News
companies using big data
5 Industries Driving Big Data Technology Growth
Big Data Exclusive

Stay Connected

1.2KFollowersLike
33.7KFollowersFollow
222FollowersPin

You Might also Like

Time To Manage Your Social Media

5 Min Read

SIA: eMarketer’s Calendar

1 Min Read

A National Strategy for Trusted Identities in Cyberspace

16 Min Read

Should Apple be more open?

4 Min Read

SmartData Collective is one of the largest & trusted community covering technical content about Big Data, BI, Cloud, Analytics, Artificial Intelligence, IoT & more.

ai in ecommerce
Artificial Intelligence for eCommerce: A Closer Look
Artificial Intelligence
AI chatbots
AI Chatbots Can Help Retailers Convert Live Broadcast Viewers into Sales!
Chatbots

Quick Link

  • About
  • Contact
  • Privacy
Follow US
© 2008-25 SmartData Collective. All Rights Reserved.
Welcome Back!

Sign in to your account

Username or Email Address
Password

Lost your password?