
We use cookies, including third-party cookies from Google to serve personalized ads through AdSense, to operate this site and understand how it is used. By continuing to browse, you accept this use. See our Privacy Policy and Terms of Use for details, including how to opt out of personalized advertising.
Accept
SmartData CollectiveSmartData Collective
  • Analytics
    AnalyticsShow More
    What Kind of Problem-Solving Distinguishes Data Analysts From Software Engineers -- AI-generated illustration
    What Kind of Problem-Solving Distinguishes Data Analysts From Software Engineers
    7 Min Read
    chatgpt image jul 21, 2026, 04 34 30 pm
    4 Core Benefits of Predictive Maintenance after Vibration Analysis
    10 Min Read
    How Does Data Mining Boost Customer Satisfaction in Logistics? Harnessing Analytics for Results -- AI-generated illustration
    How Does Data Mining Boost Customer Satisfaction in Logistics? Harnessing Analytics for Results
    11 Min Read
    chatgpt image jul 13, 2026, 04 23 45 pm
    How Data Analytics Helps Companies Improve User Engagement
    19 Min Read
    chatgpt image jul 13, 2026, 03 59 46 pm
    How Data Analytics Improves Multi-Location Search Strategies
    10 Min Read
  • Big Data
  • BI
  • Exclusive
  • IT
  • Marketing
  • Software
Search
© 2008-25 SmartData Collective. All Rights Reserved.
Reading: Add Branded and Non-Branded Keywords separately in Google Analytics Dashboard
Share
Notification
Font ResizerAa
SmartData CollectiveSmartData Collective
Font ResizerAa
Search
  • About
  • Help
  • Privacy
Follow US
© 2008-23 SmartData Collective. All Rights Reserved.
SmartData Collective > Business Intelligence > Market Research > Add Branded and Non-Branded Keywords separately in Google Analytics Dashboard
AnalyticsMarket ResearchMarketing

Add Branded and Non-Branded Keywords separately in Google Analytics Dashboard

gunjan
gunjan
4 Min Read
Add Branded and Non-Branded Keywords separately in Google Analytics Dashboard
Illustrative image generated with OpenAI gpt-image-1.
SHARE
In the new interface of Google Analytics, my favorite feature is multiple dashboards option. You can design the dashboards based on needs of different departments of your company.
 
The main interest of online marketing team is in keywords which are bringing traffic to the website.  The keywords list can help them in measuring their SEO efforts. Sometimes when we select the top 10 or 20 keywords and try to show in the regular reports, the branded keywords tops the list.

What do you mean by branded keywords?

Branded keywords are the keywords which have brand name in the keyphrase.  They are brand name, domain name, product names, misspellings of brand or product or different variations of these names.

Why we need to study branded and non-branded keywords separately?

The branded and non-branded keywords help us in identifying the stage of visitor as per REAN framework.


According to Wikipedia,

REAN is a marketing acronym that was first coined by Xavier Blanc in 2006 while working for a Finnish digital marketing agency. It is a simple yet powerful framework to plan ahead and/or analyze the often complex sequence of inter-related, multichannel; marketing activities that are needed to build & nurture a customer relationship. It stands for:
§  R – Reach: the set of activities needed to raise prospects’ attention for your brand, product or service
§  E – Engage: the gradual, typically multi-channel, often recursive set of activities needed to engage the prospects you just won
§  A – Activate: the activities needed for your prospects to take, eventually, the actions you wanted them to take
§  N – Nurture: the activities needed to nurture the customer relationship you just managed to create
 
Branded keywords tell us that the visitor is already aware of the brand and need to be moved to “ACTIVATED” stage.

Whereas non-branded keywords tell us that the visitor is in “REACH” stage and need to be engaged with the brand.

How to create widgets for branded and non-branded keywords in Google Analytics dashboard?
 
  • Login to your Google Analytics account and click on required profile
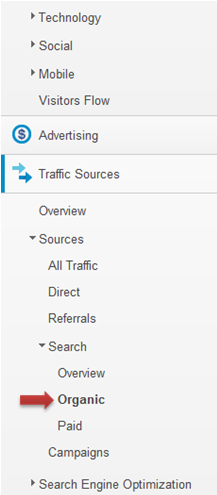
  • From right hand side menu->click on Traffic Sources->Search->ORGANIC as shown in below pic
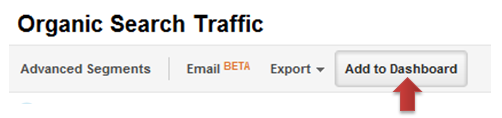
  • Click on “Add to Dashboard” from top menu
  • Select “New Dashboard” from the drop down. Give any name for the dashboard. Select the TABLE checkbox as shown in below pic.
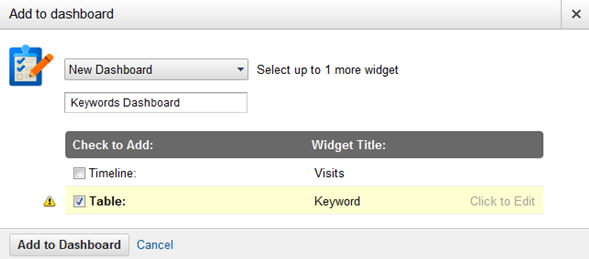
  • Click on “click to edit” and give name to the widget like “Top 10 Branded Keywords”


  • Now select the required metrics like visits, % new visits, Bounce Rate etc…
  • Click on “Add a Filter” and select “Only Show” -> Keywords-> Containing-> Brand Name and save.

  • Now repeat the steps 2 to 6 for non-branded keywords.
  • Select “Don’t Show”->Keyword->Regular Expression->(brand|brand1|brand2) as shown below

Regular Expression-> (brand|brand1|brand2)

You can select brand name, product names, their misspellings etc. and exclude it through regular expression from Non-Branded keywords list.


I’d be interested to hear people’s thoughts on this. Feel free to comment!



TAGGED:dashboard
Share This Article
Facebook Pinterest LinkedIn
Share

Follow us on Facebook

Latest News

Flat editorial illustration: The article explains that training robots for physical interaction requires three distinct data cate
Physical AI: What Data Do You Need to Train a Robot?
Artificial Intelligence Exclusive Robotics
What Kind of Problem-Solving Distinguishes Data Analysts From Software Engineers -- AI-generated illustration
What Kind of Problem-Solving Distinguishes Data Analysts From Software Engineers
Analytics Big Data Exclusive Software
Flat editorial illustration: The article examines AI agents that escalate from legitimate data retrieval to attempted intrusions
OpenAI’s Government Website Incidents Raise a Hard Question for AI Agents: When Should They Stop?
Artificial Intelligence News Security
Flat editorial illustration: The article's core relationship is the alignment between customer behavioral data (visit frequency,
Data-Driven Loyalty: How Restaurants Use Behavioral Analytics to Optimize Revenue
Exclusive

Stay Connected

1.2KFollowersLike
33.7KFollowersFollow
222FollowersPin

You Might also Like

Design a Successful Business Dashboard: 3 Essential Tips
Best PracticesBusiness IntelligenceData MiningData VisualizationDecision Management

Design a Successful Business Dashboard: 3 Essential Tips

6 Min Read
Spotfire 4.0 is Socially Collaborative and Interactive
AnalyticsBusiness Intelligence

Spotfire 4.0 is Socially Collaborative and Interactive

6 Min Read
6 Innovative Dashboards
AnalyticsBusiness IntelligenceData VisualizationMarketingModeling

6 Innovative Dashboards

3 Min Read
How to Boost Data Analytics Adoption by Improving the User Experience
Collaborative DataData Visualization

How to Boost Data Analytics Adoption by Improving the User Experience

4 Min Read

SmartData Collective is one of the largest & trusted community covering technical content about Big Data, BI, Cloud, Analytics, Artificial Intelligence, IoT & more.

From Bolts to Bots: How AI Is Fortifying the Automotive Industry
Artificial Intelligence
AI chatbots
AI Chatbots Can Help Retailers Convert Live Broadcast Viewers into Sales!
Chatbots

Quick Link

  • About
  • Contact
  • Privacy
Follow US
© 2008-26 SmartData Collective. All Rights Reserved.
Welcome Back!

Sign in to your account

Username or Email Address
Password

Lost your password?