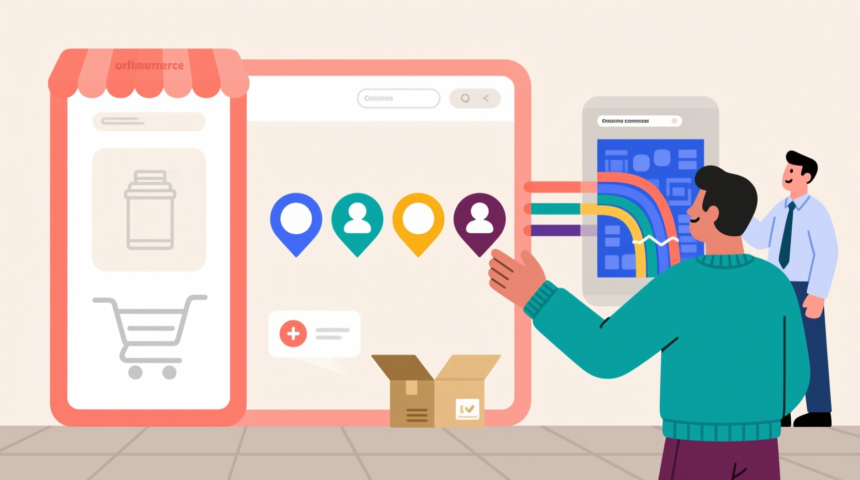
Running an eCommerce business is a challenging task. In addition to managing a huge scale of shipments and vendors, there are frequently multiple channels to manage as well. Those channels could include Amazon, eBay, Google Store, Rakuten, Alibaba, Etsy, as well as a self-managed website.
One aspect that can have a major impact on your bottom line is customer retention. In a business that tries to be everywhere all the time, and competes with many other competing vendors within the same retail space, customer retention is often ignored to keep up with shipping operations. We will explore some metrics to manage customer retention in eCommerce, no matter the channel.
Measuring Top Customers Across Channels
When offering similar products across multiple channels, the same customer may arrive at your products in multiple ways. Because the customer may prefer one channel over another, the same customer may use different user names or different email addresses in different channels.
Additionally, there may be multiple people at the same company ordering from you. This is common in larger corporations, where different departments may have similar needs, but don’t have a centralized purchasing organization to order through. While each person may make up a small percentage of sales, the company’s activity in total may make up a much larger percentage.

The best way to track your top customers is run a query to group by shipping address, and then by customer name. Be sure to add the second address line to determine whether each person is actually related to others in the same address (such as corporate offices), or not related to others in the same address (such as apartment buildings).
In SQL terms, if all orders are in the same table, your query might look something similar to this:
SELECT StreetAddress1, StreetAddress2, FullName, SUM(OrderTotal)
FROM Orders
GROUP BY StreetAddress1, StreetAddress2, FullName
ORDER BY StreetAddress1 ASC
If your orders are stored in separate databases, use the UNION ALL statement:
SELECT StreetAddress1, StreetAddress2, FullName, SUM(OrderTotal)
FROM Channel1.Orders
GROUP BY StreetAddress1, StreetAddress2, FullName
UNION ALL
SELECT StreetAddress1, StreetAddress2, FullName, SUM(OrderTotal)
FROM Channel2.Orders
GROUP BY StreetAddress1, StreetAddress2, FullName
ORDER BY StreetAddress1 ASC
To increase customer retention, take the next step to reach out to top customers via email. Build a relationship with this customer by learning their needs for your products. Discuss future opportunities to meet their business needs. Additionally, if the customer is critical to your business, you can offer a quantity discount or “VIP Membership” level of service for continued business.
Returns by Customer
The key to building customer retention is providing the highest quality service at all times. This includes the ability to right a wrong. Tracking returns by customers is a next-level method of finding potential customers that should be the target of your retention efforts. To find these customers, you would need to create a similar query, which in SQL might look like this:
SELECT * FROM(
	SELECT StreetAddress1, FullName, COUNT(RMANumber)
	FROM Orders
	WHERE RMANumber Is Not Null
	GROUP BY Address1, FullName) a
ORDER BY a.RMANumber ASC
In e-commerce, with a high scale of products offered, and a high scale of unique customers, communication may be low-quality, or non-existent. Once you’ve identified customers with regular returns, you can contact them and seek out more information behind their reasoning. Are the products lacking in quality? Are the products not meeting specifications? If there are no pressing issues, should the customer pay re-stocking fees to reduce their likelihood to return in the future?
Returns by Product
Similar to measuring returns by customers, measuring returns by product could highlight issues in product quality. Perhaps a certain product or line of products is being returned often, leading to customer churn? An SQL query to find these products could be:
SELECT * FROM(
	SELECT Orders.ProductID, Products.ProductName, COUNT(Orders.RMANumber)
	FROM Orders INNER JOIN Products ON Orders.ProductID = Products.ProductID
	WHERE Orders.RMANumber Is Not Null
	GROUP BY Orders.ProductID, Products.ProductName) a
ORDER BY a.RMANumber ASC
To increase customer retention, send out a survey to customers who have returned the same products. Ask them several questions as to why they returned the product: Did the customer receive the correct size? Did the product meet quality specifications? Were there issues with packaging or shipping damage?
Additionally, read any comments if available in your sales channels. Use a word cloud or text aggregator to look for most frequently used words.
Top sales of products by channel
When offering similar products across multiple channels, different products may sell at different rates in different channels. One product may be very popular on Amazon, and not at all on eBay. Another product may be very successful with repeat customers on an internal website, and may not be available on any other channel.
The differences may be in listing. If not all products are available on all channels, it is implicit why sales are different between channels.
The differences may be in clientele. Alibaba specializes in selling bulk / wholesale items, Amazon specializes in general retail items, and eBay specializes in selling used items.
The difference may be in the channel’s user experience. Amazon specializes in shopping carts, allowing customers to order multiple products at one time. Amazon also recommends similar products while shopping, including “Most Frequently Purchased Together” or “People Who Bought X Also Bought Y” suggestions. In comparison, other channels like eBay are more transactional with individual listings and don’t offer suggested results.
To compile the top 10 products in sales for each channel, use a query similar to this:
(SELECT “Channel1”, Channel1.Orders.ProductID, Channel1.Products.ProductName, SUM(Channel1.Orders.OrderTotal)
FROM Channel1.Orders INNER JOIN Products ON Channel1.Orders.ProductID = Products.ProductID
LIMIT 10)
UNION ALL
(SELECT “Channel2”, Channel2.Orders.ProductID, Channel2.Products.ProductName, SUM(Channel2.Orders.OrderTotal)
FROM Channel2.Orders INNER JOIN Products ON Channel2.Orders.ProductID = Products.ProductID
LIMIT 10)
…
Bonus: Using Customer Contact Information for Marketing
In addition to attracting new customers, your marketing efforts should be geared towards retaining existing ones and nudging them towards additional purchases. Depending on the terms and conditions of your site and the type of data you collect, it’s possible that you have a lot of useful information in your database, which you can use for running targeted campaigns.
As a retailer, you typically receive lots of contact information from your customers. In addition to names and shipping addresses, you likely also receive email addresses, phone numbers, and possibly social media usernames. You can use an SQL query to pull together this information, like so:
SELECT DISTINCT FullName, StreetAddress1, StreetAddress2, City, State, Zip, EmailAddress, PhoneNumber, FBID
FROM Orders
To increase customer retention, use this information to develop marketing campaigns. The easiest, quickest, and cheapest marketing campaign is a mass email to all former customers, informing them of new products, special deals, or offers for “VIP membership” benefits. If your products are higher in purchase price, more expensive contact methods, such as phone calls and direct mail, may prove to be more effective than email.