We use cookies, including third-party cookies from Google to serve personalized ads through AdSense, to operate this site and understand how it is used. By continuing to browse, you accept this use. See our Privacy Policy and Terms of Use for details, including how to opt out of personalized advertising.
Accept
SmartData CollectiveSmartData Collective
  • Analytics
    AnalyticsShow More
    chatgpt image jul 21, 2026, 04 34 30 pm
    4 Core Benefits of Predictive Maintenance after Vibration Analysis
    10 Min Read
    How Does Data Mining Boost Customer Satisfaction in Logistics? Harnessing Analytics for Results -- AI-generated illustration
    How Does Data Mining Boost Customer Satisfaction in Logistics? Harnessing Analytics for Results
    11 Min Read
    chatgpt image jul 13, 2026, 04 23 45 pm
    How Data Analytics Helps Companies Improve User Engagement
    19 Min Read
    chatgpt image jul 13, 2026, 03 59 46 pm
    How Data Analytics Improves Multi-Location Search Strategies
    10 Min Read
    cybersecurity efforts
    How Behavioral Analytics and AI Are Redefining Cybersecurity for Boca Raton Businesses
    14 Min Read
  • Big Data
  • BI
  • Exclusive
  • IT
  • Marketing
  • Software
Search
© 2008-25 SmartData Collective. All Rights Reserved.
Reading: Why normalization matters with K-Means
Share
Notification
Font ResizerAa
SmartData CollectiveSmartData Collective
Font ResizerAa
Search
  • About
  • Help
  • Privacy
Follow US
© 2008-23 SmartData Collective. All Rights Reserved.
SmartData Collective > Big Data > Data Mining > Why normalization matters with K-Means
Data MiningPredictive Analytics

Why normalization matters with K-Means

DeanAbbott
DeanAbbott
4 Min Read
Why normalization matters with K-Means
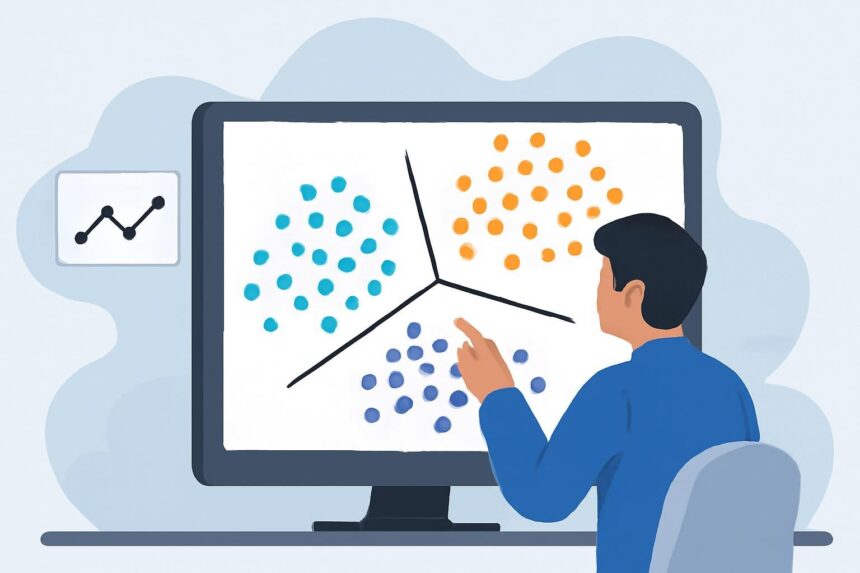
Illustrative image generated with OpenAI gpt-image-1.
SHARE

A question about K-means clustering in Clementine was posted here. I thought I knew the answer, but took the opportunity to prove it to myself.

I took the KDD-Cup 98 data and just looked at four fields: Age, NumChild, TARGET_D (the amount the recaptured lapsed donors gave) and LASTGIFT. I took only four to make the problem simpler, and chose variables that had relatively large differences in mean values (where normalization might matter). Also, another problem with the two monetary variables is that they are both skewed positively (severely so).

The following image shows the results of two clustering runs: the first with raw data, the second with normalized data using the Clementine K-Means algorithm. The normalization consisted of log transforms (for TARGET_D and LASTGIFT) and z-scores for all (the log transformed fields, AGE and NUMCHILD). I used the default of 5 clusters.

Here are the results in tabular form. Note that I’m reporting unnormalized values for the “normalized” clusters even though the actual clusters were formed by the normalized values. This is purely for comparative purposes.


More Read

Australian National Broadband Roll Out
Text Mining Strategies and Limitations with Scalable Data Solutions
What’s the Big Deal About Big Data?
SQL Visualization in the Spreadsheet
Adventures in Data Profiling (Part 1)

Note that:
1) the results are different, as measure by counts in each cluster
2) the unnormalized clusters are dominated by TARGET_D and LASTGIFT–one cluster contains the large values and the remaining have little variance.
3) AGE and NUMCHILD have some similar breakouts (40s with more children and 40s with fewer children for example).

So, the conclusion is (to answer the original question) K-Means in Clementine does not normalize the data. Since Euclidean distance is used, the clusters will be influenced strongly by the magnitudes of the variables, especially by outliers. Normalizing removes this bias. However, whether or not one desires this removal of bias depends on what one wants to find: sometimes if one would want a variable to influence the clusters more, one could manipulate the clusters precisely in this way, by increasing the relative magnitude of these fields.

One last issue that I didn’t explore here, is the effects of correlated variables (LASTGIFT and TARGET_D to some degree here). It seems to me that correlated variables will artificially bias the clusters toward natural groupings of those variables, though I have never proved the extent of this bias in a controlled way (maybe someone can point to a paper that shows this clearly).


Share This Article
Facebook Pinterest LinkedIn
Share

Follow us on Facebook

Latest News

Flat editorial illustration: The article's core relationship is the brand protection response workflow: detection of a phishing o
Data & AI Architecture Focus: 6 Best Brand Protection Tools for Phishing and Impersonation
IT Security
Server racks with cloud and user interface panels
Cloud Infrastructure and Workload Migration: A Data-Driven Look at VMware Alternatives in Europe
Cloud Computing Exclusive
Synthetic Data vs Real Web Data: Comparison, Limitations, and Collection Methods  -- AI-generated illustration
Synthetic Data vs Real Web Data: Comparison, Limitations, and Collection Methods 
Big Data Exclusive
Illustration of mobile analytics dashboards with ad performance charts connected to backend databases
11 Best Sisense Alternatives for Embedded Analytics
Business Intelligence Exclusive

Stay Connected

1.2KFollowersLike
33.7KFollowersFollow
222FollowersPin

You Might also Like

Big Data Analytics - Volume, Variety, Velocity
AnalyticsBusiness IntelligenceData MiningData WarehousingHadoopMarket ResearchPredictive AnalyticsText Analytics

Big Data Analytics – Volume, Variety, Velocity

0 Min Read
Worst Practices While Deploying a Predictive Model
Predictive Analytics

Worst Practices While Deploying a Predictive Model

10 Min Read
5 Common Use Cases for Hadoop in Retail
AnalyticsBig DataData VisualizationHadoopMapReduceMarketing AutomationModelingPredictive AnalyticsSentiment AnalyticsSocial DataSocial Media AnalyticsSoftwareSQLText AnalyticsUnstructured DataWeb Analytics

5 Common Use Cases for Hadoop in Retail

5 Min Read
Morgan Stanley Understands How To Leverage Their Big Data
Big DataData Mining

Morgan Stanley Understands How To Leverage Their Big Data

5 Min Read

SmartData Collective is one of the largest & trusted community covering technical content about Big Data, BI, Cloud, Analytics, Artificial Intelligence, IoT & more.

AI chatbots
AI Chatbots Can Help Retailers Convert Live Broadcast Viewers into Sales!
Chatbots
5 Great Tips for Using Data Analytics for Website UX
Big Data

Quick Link

  • About
  • Contact
  • Privacy
Follow US
© 2008-26 SmartData Collective. All Rights Reserved.
Welcome Back!

Sign in to your account

Username or Email Address
Password

Lost your password?