We use cookies, including third-party cookies from Google to serve personalized ads through AdSense, to operate this site and understand how it is used. By continuing to browse, you accept this use. See our Privacy Policy and Terms of Use for details, including how to opt out of personalized advertising.
Accept
SmartData CollectiveSmartData Collective
  • Analytics
    AnalyticsShow More
    What Kind of Problem-Solving Distinguishes Data Analysts From Software Engineers -- AI-generated illustration
    What Kind of Problem-Solving Distinguishes Data Analysts From Software Engineers
    7 Min Read
    chatgpt image jul 21, 2026, 04 34 30 pm
    4 Core Benefits of Predictive Maintenance after Vibration Analysis
    10 Min Read
    How Does Data Mining Boost Customer Satisfaction in Logistics? Harnessing Analytics for Results -- AI-generated illustration
    How Does Data Mining Boost Customer Satisfaction in Logistics? Harnessing Analytics for Results
    11 Min Read
    chatgpt image jul 13, 2026, 04 23 45 pm
    How Data Analytics Helps Companies Improve User Engagement
    19 Min Read
    chatgpt image jul 13, 2026, 03 59 46 pm
    How Data Analytics Improves Multi-Location Search Strategies
    10 Min Read
  • Big Data
  • BI
  • Exclusive
  • IT
  • Marketing
  • Software
Search
© 2008-25 SmartData Collective. All Rights Reserved.
Reading: IB Olympiad System Outline
Share
Notification
Font ResizerAa
SmartData CollectiveSmartData Collective
Font ResizerAa
Search
  • About
  • Help
  • Privacy
Follow US
© 2008-23 SmartData Collective. All Rights Reserved.
SmartData Collective > Analytics > Predictive Analytics > IB Olympiad System Outline
Predictive Analytics

IB Olympiad System Outline

Editor SDC
Editor SDC
2 Min Read
IB Olympiad System Outline
Illustration generated with FLUX.2 [klein 4B] via Cloudflare Workers AI.
SHARE

The first version of the system will be organized as follows:

Variables
Load data
Preprocess
Forecast each data stream
Optional: sensitivity analysis
Create a portfolio
Calculate position size
Repeat (weekly?)

Here are the stub Matlab files. This is basically a shell to test each piece of the system as they are created. Sys1.m is the script that runs each step, however steps can be run individually. Each step is implemented as a function with certain inputs and outputs rather than as a series of scripts. I am open to suggestions for refactoring.

The loaddata.m file is the longest so far- it pulls data from Yahoo finance. For forecasting I will probably use libSVM.

Lastly, here is a list of functions that looked like they will be useful. Most are from the statistics and financial toolboxes; svms are in the bioinformatics toolbox but I’ll probably use libSVM instead since it’s familiar to me.

More Read

The Commoditization of Analytics
Overfitting II: Out-of-Sample Testing
Demographics Meet Analytics: An Interview with comScore CMO Linda Abraham
Big Analytics: Closing the ‘Clue Gap’ with Big Data
Predictive Analytics: 4 Primary Aspects of Predictive Analytics

Please feel free to suggest or criticize anything.
Share This Article
Facebook Pinterest LinkedIn
Share

Follow us on Facebook

Latest News

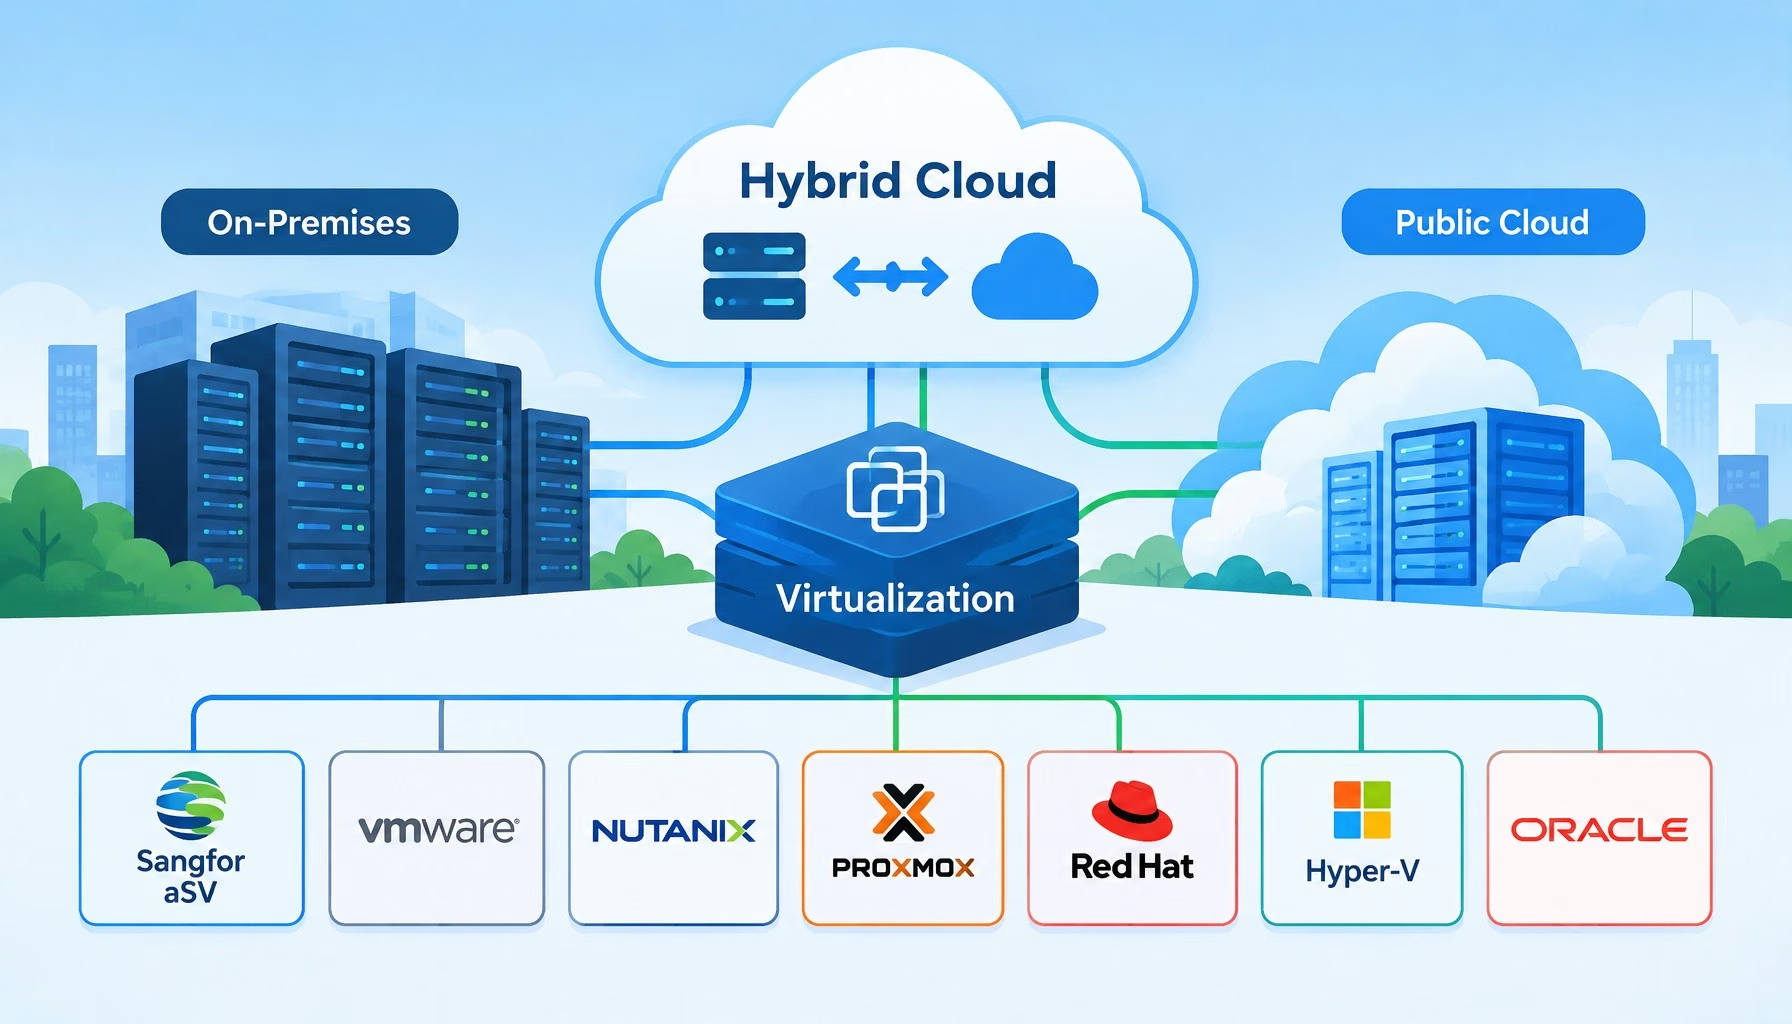
Flat editorial illustration: The article's core relationship is the hypervisor as the abstraction layer that makes hybrid cloud p
7 Best Virtualization Platforms for Hybrid Cloud Environments
Big Data
Flat editorial illustration: The article's core relationship is between aggregated workplace data (occupancy, environmental, feed
How Businesses Can Use Workplace Data to Create Better Office Environments
Big Data Business Intelligence Exclusive
Flat editorial illustration: The article's core relationship is the engineering transition from an AI prototype to a production-r
From AI Prototype to Production: Observability and Scalability Requirements for Data-Heavy SaaS Applications
Artificial Intelligence Exclusive
Preparing Data Systems and Governance for a Scaling Global Gaming Brand -- AI-generated illustration
Preparing Data Systems and Governance for a Scaling Global Gaming Brand
Big Data Infographic

Stay Connected

1.2KFollowersLike
33.7KFollowersFollow
222FollowersPin

You Might also Like

Big Data Is Changing Every Industry, Even Yours!
Big DataBusiness IntelligenceBusiness RulesCloud ComputingData MiningDecision ManagementHadoopITLocationMapReduceMobilityModelingOpen SourcePredictive AnalyticsSocial DataSocial Media AnalyticsSoftwareUnstructured DataWeb AnalyticsWorkforce AnalyticsWorkforce Data

Big Data Is Changing Every Industry, Even Yours!

7 Min Read
The New Way to Segment For a 6x Greater Return
AnalyticsBest PracticesData MiningMarketingPredictive Analytics

The New Way to Segment For a 6x Greater Return

5 Min Read
Yes, Computers Can Stereotype Now
Predictive Analytics

Yes, Computers Can Stereotype Now

6 Min Read
How to Stay Out of Cash Flow Crises Using Cash Position Analysis
AnalyticsBusiness IntelligenceData QualityData VisualizationData WarehousingPredictive AnalyticsRisk Management

How to Stay Out of Cash Flow Crises Using Cash Position Analysis

6 Min Read

SmartData Collective is one of the largest & trusted community covering technical content about Big Data, BI, Cloud, Analytics, Artificial Intelligence, IoT & more.

Chatbots and SEO: How Can Chatbots Improve Your SEO Ranking?
Artificial Intelligence Chatbots Exclusive
Artificial Intelligence for eCommerce: A Closer Look
Artificial Intelligence

Quick Link

  • About
  • Contact
  • Privacy
Follow US
© 2008-26 SmartData Collective. All Rights Reserved.
Welcome Back!

Sign in to your account

Username or Email Address
Password

Lost your password?